Futures Basis, Premium and Discount: Cost of Carry Explained
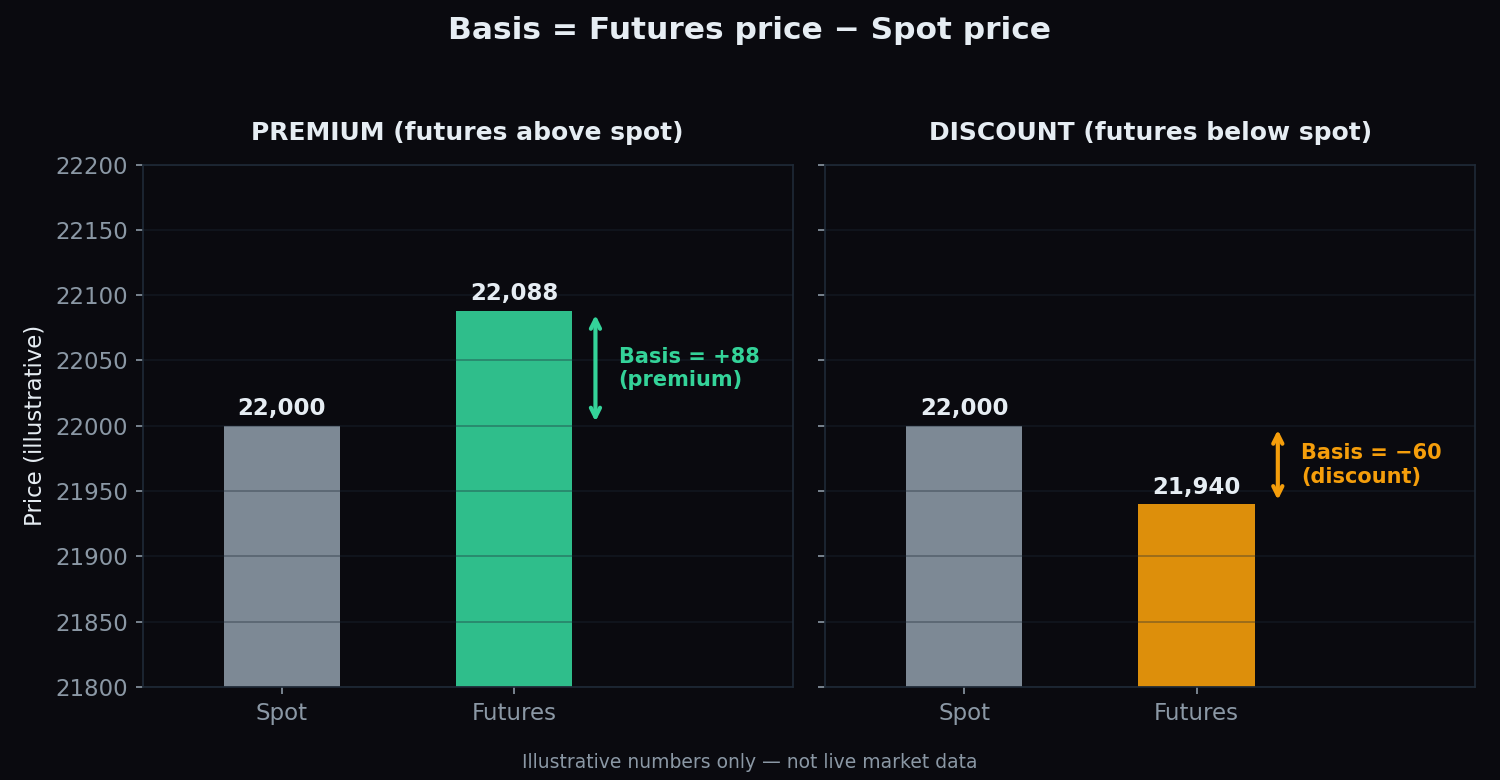
Look at any quote screen during market hours and you will often see two different prices for the "same" thing: the Nifty index at, say, 22,000, and the Nifty futures contract at 22,088. Neither price is wrong. The 88-point gap between them has a name — the basis — and it exists for a boring, mechanical reason called the cost of carry. This post explains the gap with simple numbers.
Three words to define first
- Spot price — the price of the thing right now. For Nifty, the spot is simply the live index level.
- Futures price — the price of a futures contract: an agreement to settle the index at a fixed date in the future (the expiry).
- Basis — the difference between the two: basis = futures price − spot price.
When the basis is positive — futures trading above spot — the futures are said to be at a premium (textbooks call this contango). When the basis is negative — futures below spot — they are at a discount (textbooks: backwardation). That is the entire vocabulary.
Why is there a gap at all?
Think of booking a scooter today for delivery next month. The dealer quotes a little more than the showroom price. Why? Because for one month the dealer must keep money tied up in that scooter — money that could otherwise sit in the bank earning interest — and must store it. The forward price = today's price + the cost of carrying it for a month.
An index future works the same way, except there is nothing physical to store. If you hold the futures contract instead of the 50 underlying shares, your cash stays in the bank earning interest for the month — an advantage the futures price charges you for. On the other hand, holding futures means you miss any dividends the underlying companies pay during the month — a disadvantage the price refunds you. So:
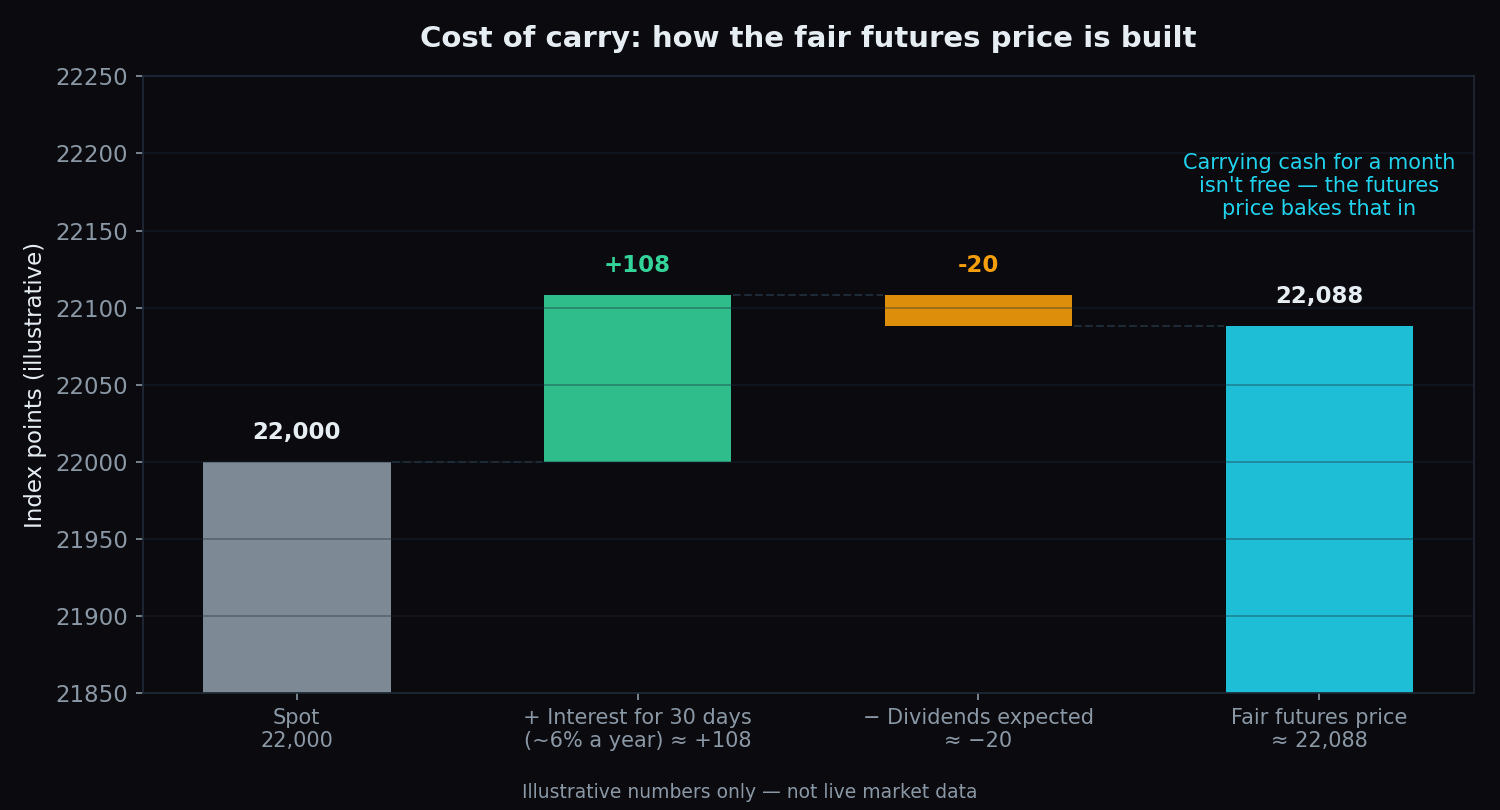
Fair futures price ≈ spot price + interest for the period − dividends expected in the period. That "interest minus dividends" part is the cost of carry. A normal premium is mostly just interest — not a bullish opinion.
A worked example with round numbers
Suppose Nifty spot is at 22,000, the futures contract expires in 30 days, and money in the bank earns about 6% a year. Also suppose the index's companies will pay dividends worth about 20 index points this month. Then:
- Interest for 30 days = 22,000 × 6% × (30 ÷ 365) ≈ 108 points
- Dividends expected ≈ 20 points
- Fair futures price ≈ 22,000 + 108 − 20 = 22,088
That is where the 88-point premium in the opening example came from. No prediction, no sentiment — just the arithmetic of interest and dividends.
Real futures rarely sit exactly at fair value, but they rarely drift far from it either. If the gap grows too wide, arbitrage desks — professionals who trade both sides of the same asset to pocket a riskless difference — step in and squeeze the gap back. Retail traders cannot usually capture this difference; after costs it belongs to the fastest, cheapest players.
How traders read premium and discount
Because a normal premium is mostly interest, the useful reading is not "premium vs zero" but "premium vs fair value":
- Premium near fair value — the default state. It says nothing about direction.
- Premium much wider than fair value — futures demand is running hot; leveraged long positioning is aggressive. Often read as short-term froth.
- Premium shrinking, or a discount — futures are being sold harder than the cash market, often by hedgers protecting portfolios. A discount can also appear mechanically in heavy dividend months, with no fear involved.
These are descriptions of positioning, not forecasts. A wide premium has preceded both rallies and sell-offs; on its own it is context, best read alongside open interest and the broader rate environment that sets the carry itself.
The basis has an expiry date
Here is the elegant part: the basis is born, shrinks and dies on a schedule. With 30 days left, a month of interest is priced in. With 10 days left, only 10 days' worth. On expiry day the futures settle at the spot closing level, so the gap must reach zero. This is called convergence.
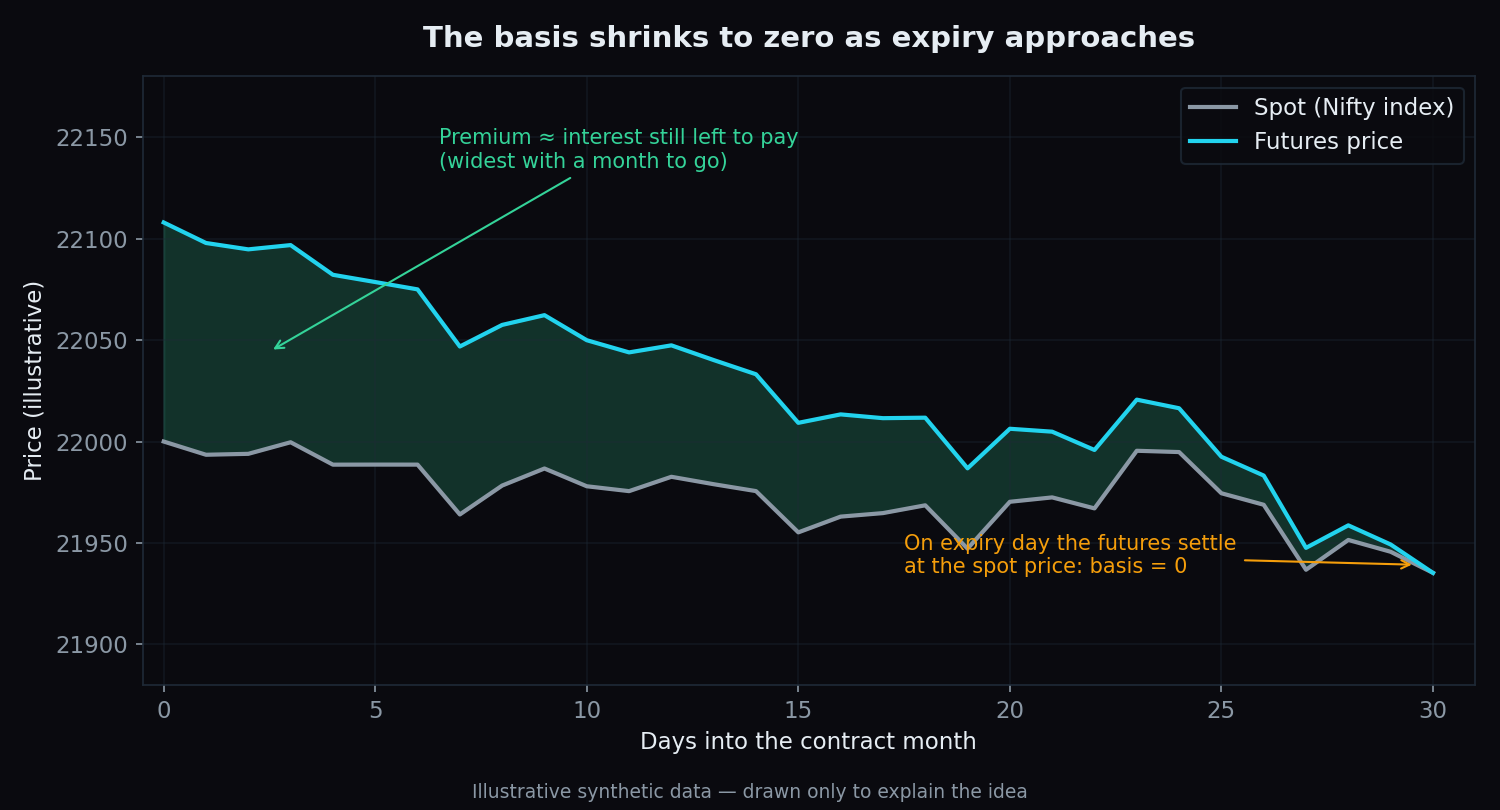
This is also why the basis appears to "jump" around expiry week: quotes switch to the next month's contract, which carries a fresh month of interest. That hand-over is the rollover, and the reborn premium is calendar mechanics, not sudden bullishness.
The honest catch
- Most of the premium is just interest. Treating a normal premium as a bullish signal is the most common beginner misreading of the basis.
- A discount is not automatically bearish. Dividend seasons and hedging flows both produce discounts for unrelated reasons.
- The basis is noisy intraday. Spot and futures tick at slightly different moments, so second-to-second basis readings wobble meaninglessly.
- Beware precise claims. Anyone quoting an exact hit-rate for "wide premium means X" should also show the sample size behind it. Without an n, it is a story, not a statistic.
Understood this way, the basis is less a crystal ball and more a thermometer: it tells you the temperature of futures positioning relative to plain arithmetic — and that is genuinely useful context for reading the market's mood.
TrueTrend turns structure like this into one clear, at-a-glance read — live positioning context across Nifty, Bank Nifty and F&O, with its own track record scored in public. Create a free account to see today's picture.
See these concepts on live market data — free
Create a free TrueTrend account to watch daily support/resistance levels, market regime, and option-positioning charts on NIFTY, BankNifty and 12 more instruments. Every level we publish is scored on a public scoreboard — misses included. No card required.
Free forever tier · daily levels with published hit-rates across every instrument. Descriptive market structure, not investment advice.
Not ready for an account? Get the daily levels by email.
One short email each market day — the indices' call wall, put wall, gamma flip and max pain, and how the last session's levels scored. Free, no account, unsubscribe anytime.
Descriptive market structure, not investment advice. We never share your email.