Futures Rollover Data: How to Read Monthly Rollover Percentages
Every month, a few days before futures expiry, market coverage starts quoting one number: "Nifty rollover stood at 78%." It sounds important, and it is — but only if you know what it measures. This guide explains where the rollover percentage comes from, how it is calculated, and how experienced readers actually use it: as a gauge of conviction, read against its own history, never as a forecast on its own.
A quick recap: what "rolling over" means
A futures contract is an agreement to settle a trade at a fixed date — the expiry. In India, monthly index and stock futures expire on a fixed day near the end of each month (the exact weekday has changed over the years — see our guide to expiry days on NSE and BSE).
A trader who wants to keep a position beyond expiry cannot simply hold the old contract. Instead, they close the current-month contract and open the same position in the next-month contract. That two-step move is a rollover. If this is new to you, start with our plain-English primer on what futures rollover is — this post is about reading the data it produces.
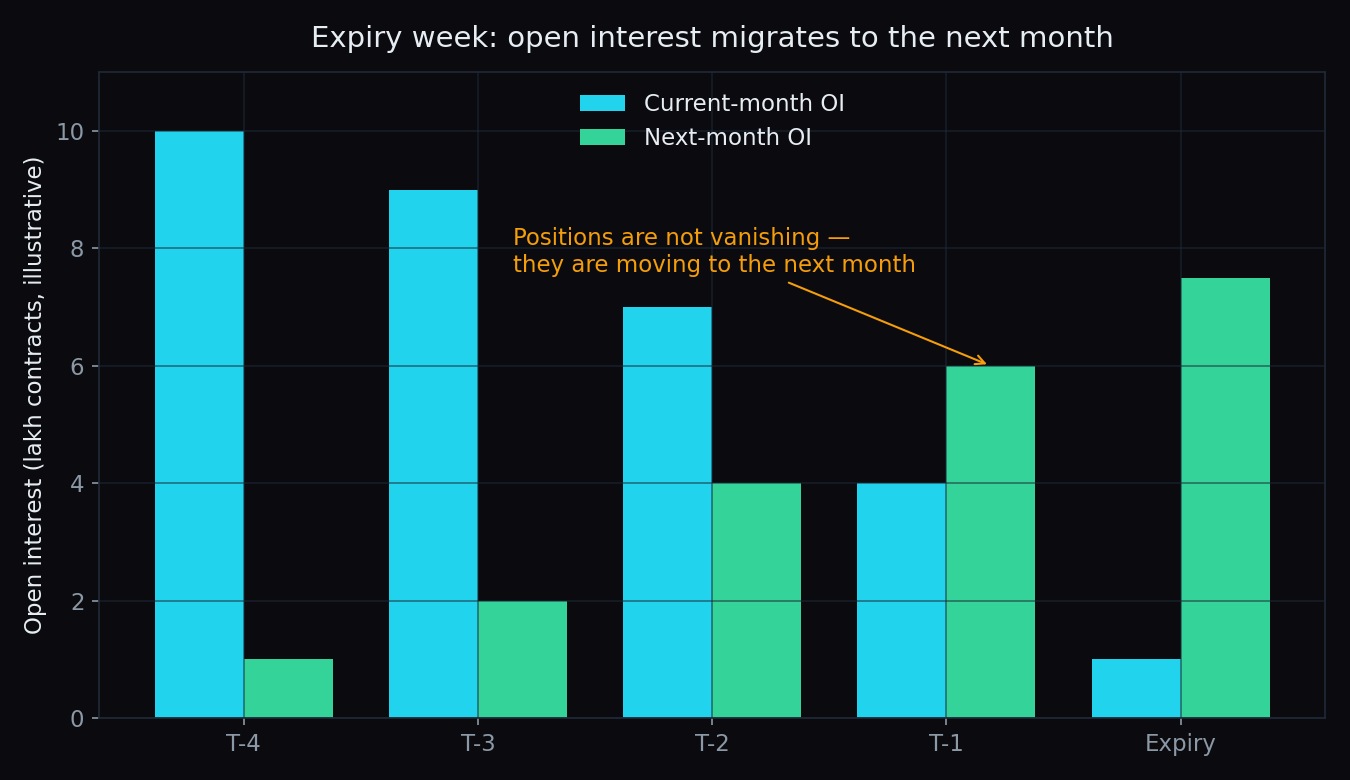
The chart above (illustrative numbers) shows the pattern that repeats every expiry week: open interest (OI) in the current month drains away while OI in the next month swells. The positions are not disappearing — they are migrating.
An everyday analogy: the hotel on checkout day
Think of the current-month contract as a hotel where every guest must check out on the same day. On checkout morning, each guest makes a choice: extend the stay by booking the next month, or leave.
The rollover percentage is simply the share of guests who chose to extend. If 75 of 100 guests booked another month, the "rollover" is 75%. A high number says the guests still find the stay worthwhile. It does not say why each guest stayed — some are enjoying the pool, some are just too busy to move out. Keep that limitation in mind; we will come back to it.
The formula, with simple round numbers
Measured around expiry, the calculation is:
Rollover % = open interest carried into later months ÷ total open interest across all months
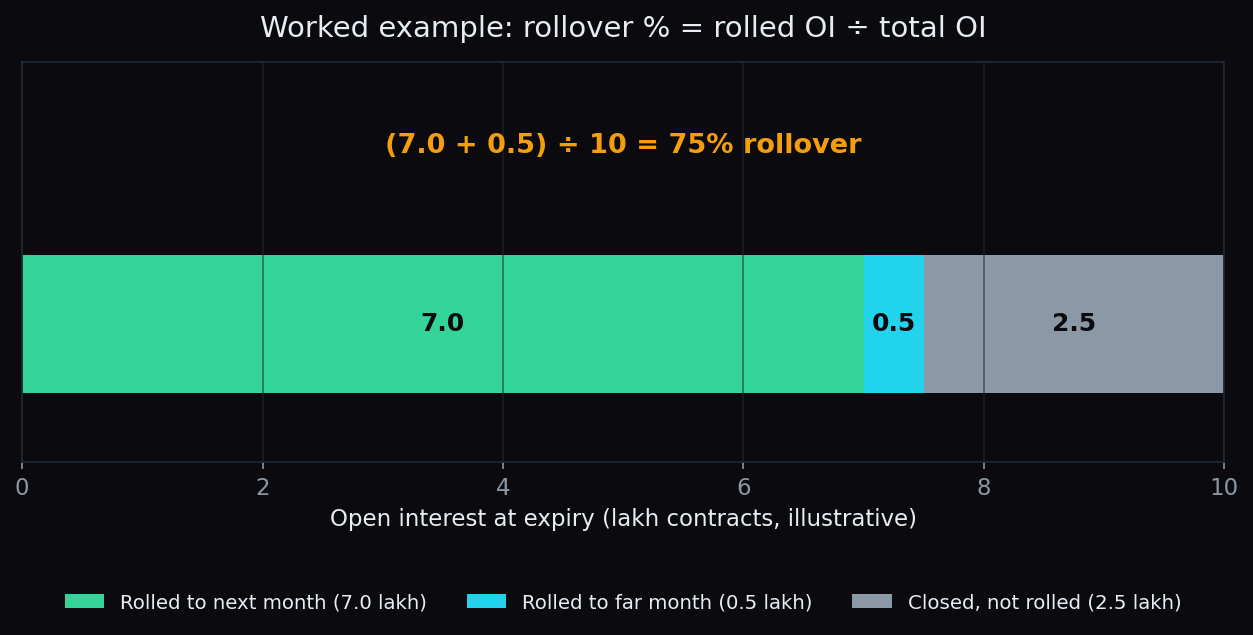
A worked example with round, illustrative numbers. Suppose at expiry a stock's futures show a total of 10 lakh contracts of open interest across all three listed months:
- 7 lakh contracts sit in the next-month series (positions carried forward),
- 0.5 lakh sit in the far-month series (also carried forward),
- 2.5 lakh were in the expiring month and simply closed.
Rollover = (7 + 0.5) ÷ 10 = 75%. Three out of every four open positions chose to stay in the game.
Data sources differ slightly in when they take this snapshot (expiry-day close is common) and whether they quote it on the expiring series only. The exact recipe matters less than using the same source consistently, because the number is only meaningful in comparison to itself.
How to read the number: against its own average
Here is the key habit that separates casual readers from careful ones: a rollover percentage means almost nothing in isolation. 78% — is that high? Low? You cannot know without context. For index futures the month-end reading has historically tended to land in a broad band of roughly 70–80%, but the level drifts over time and differs by instrument, so check the exchange's monthly derivatives statistics rather than trusting a remembered figure.
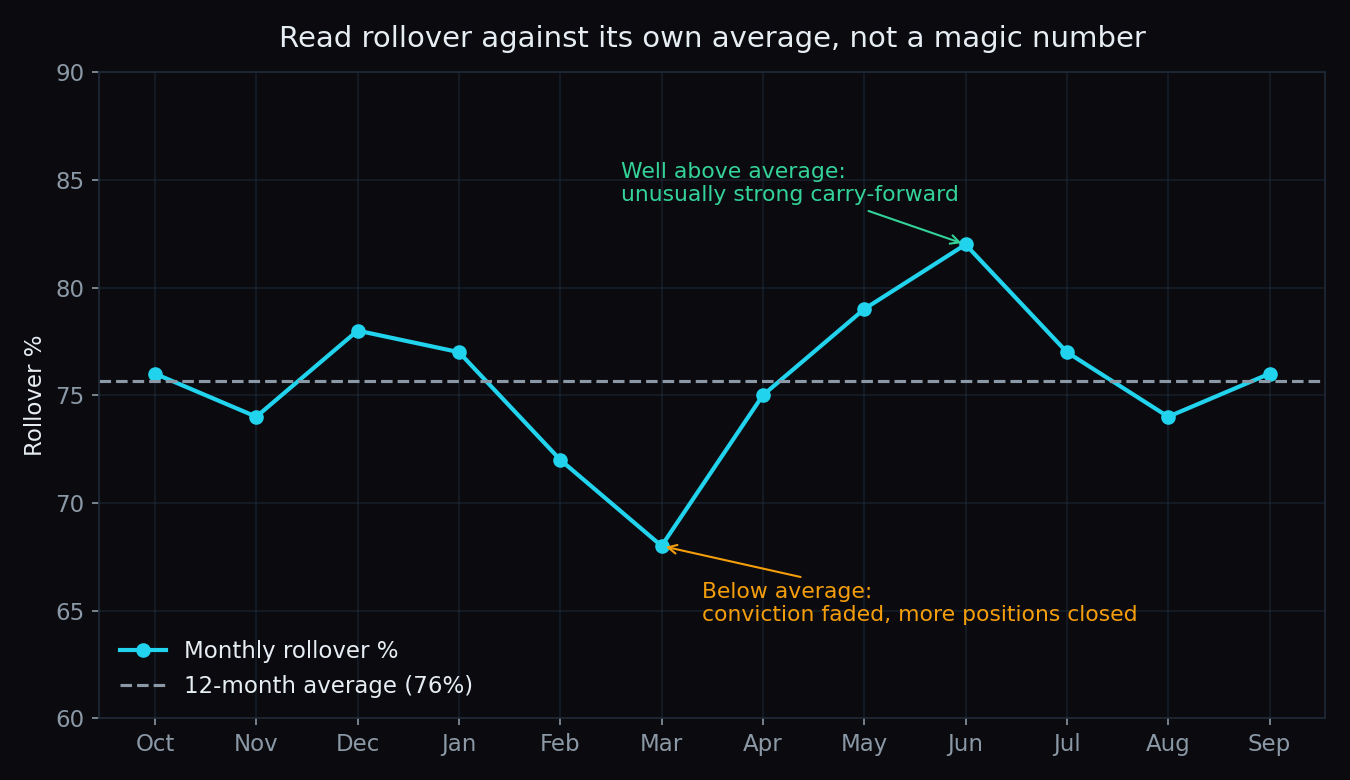
The useful comparison is the instrument's own recent average (say, the last three to twelve expiries). In the illustrative chart above, the average is 76%:
- Well above average (82%): an unusually large share of positions was carried forward. Traders, in aggregate, wanted to stay in their trades.
- Well below average (68%): conviction faded. More positions were closed at expiry than usual, and fewer traders paid the cost of carrying on.
The second half of the reading is at what price positions rolled. The next-month contract normally trades a little above the spot price — a premium that reflects the cost of carry. Analysts read the pair together: a high rollover into a firm premium suggests long positions were carried forward willingly, while a high rollover with the next month at a discount suggests it was largely short positions that stayed on. Same rollover number, very different mood.
What rollover data cannot tell you
This is the honest part, and it matters more than the formula.
- It is an aggregate. The number lumps together every kind of trader — hedgers, arbitrageurs, directional punters. A hedger rolling a routine hedge and a trader doubling down look identical in the data.
- It has no direction on its own. Both long and short positions roll. Without the premium/discount context (and change-in-OI data), a bare rollover % says "commitment", not "bullish" or "bearish".
- Single-stock numbers get distorted. Position limits and the F&O ban period (MWPL) can mechanically suppress or delay rolls in individual stocks. Lot-size revisions and index changes muddy month-to-month comparisons too.
- It is a snapshot of one day. A position rolled at expiry can be closed the very next morning. Rollover measures intent at one moment, not a promise about the month ahead.
Key takeaway: rollover % is a conviction gauge, not a crystal ball. Read it against the same instrument's own recent average, always alongside the premium or discount at which positions rolled — and treat it as context for the new series, never as a standalone forecast.
A reader's checklist for expiry week
What experienced readers typically note, in order:
- The headline rollover % for the index or stock, from a consistent source.
- Its own recent average (last 3–12 expiries) — is this month unusual, or normal?
- The premium or discount on the next-month contract while positions rolled.
- Fresh OI in the new series over the first few sessions — did the carried positions stay, grow, or quietly unwind?
- Special situations — stocks in the ban list, lot-size changes, or index rejigs that distort the comparison.
None of this predicts the next move. It tells you how committed the market arrived at the new month — which is exactly the kind of context that makes the rest of the tape easier to read.
TrueTrend turns positioning data like this into a clear, at-a-glance read across Nifty, Bank Nifty and F&O stocks — and it scores its own calls-it-as-data track record in public on the live scoreboard, so you can judge the evidence before you trust it.
See these concepts on live market data — free
Create a free TrueTrend account to watch daily support/resistance levels, market regime, and option-positioning charts on NIFTY, BankNifty and 12 more instruments. Every level we publish is scored on a public scoreboard — misses included. No card required.
Free forever tier · daily levels with published hit-rates across every instrument. Descriptive market structure, not investment advice.
Not ready for an account? Get the daily levels by email.
One short email each market day — the indices' call wall, put wall, gamma flip and max pain, and how the last session's levels scored. Free, no account, unsubscribe anytime.
Descriptive market structure, not investment advice. We never share your email.