On-Balance Volume (OBV) Explained: When Volume Leads Price
Two stocks close 2 per cent higher on the same day. In the first, 50 lakh shares changed hands; in the second, just 5 lakh. The price change looks identical — but the conviction behind it is not. On-Balance Volume (OBV) is a simple running score that keeps track of exactly that difference, one day at a time.
What is On-Balance Volume?
OBV is a volume indicator. Volume is the number of shares (or contracts) traded in a period. OBV takes each day's volume and adds it to a running total when the price closes higher than the day before, or subtracts it when the price closes lower. The result is a single line that rises when up-days carry more volume and falls when down-days do.
The idea comes from analyst Joe Granville, who popularised it in his 1963 book Granville's New Key to Stock Market Profits. His one-line thesis: volume precedes price. Large players cannot hide the size of their activity, so a change in volume behaviour often shows up before price fully reacts. That claim does not always hold — more on the catch below — but it is the logic behind the indicator.
An everyday analogy: the turnstile counter
Think of a stock as a cricket stadium. The scoreboard is the price — it tells you how the match is going. The turnstile counter at the gate is the volume — it tells you how many people are actually walking in or out.
OBV is a net turnstile count. If the scoreboard says the home team is winning but the stands are quietly emptying, the "win" is less convincing than it looks. If the score is flat but the stadium keeps filling up, interest is building even though the scoreboard has not moved yet. OBV exists to catch those two situations.
How OBV is calculated: a worked example
Three rules, applied on closing prices:
- Close higher than yesterday → add today's entire volume to the total.
- Close lower than yesterday → subtract today's entire volume.
- Close unchanged → do nothing.
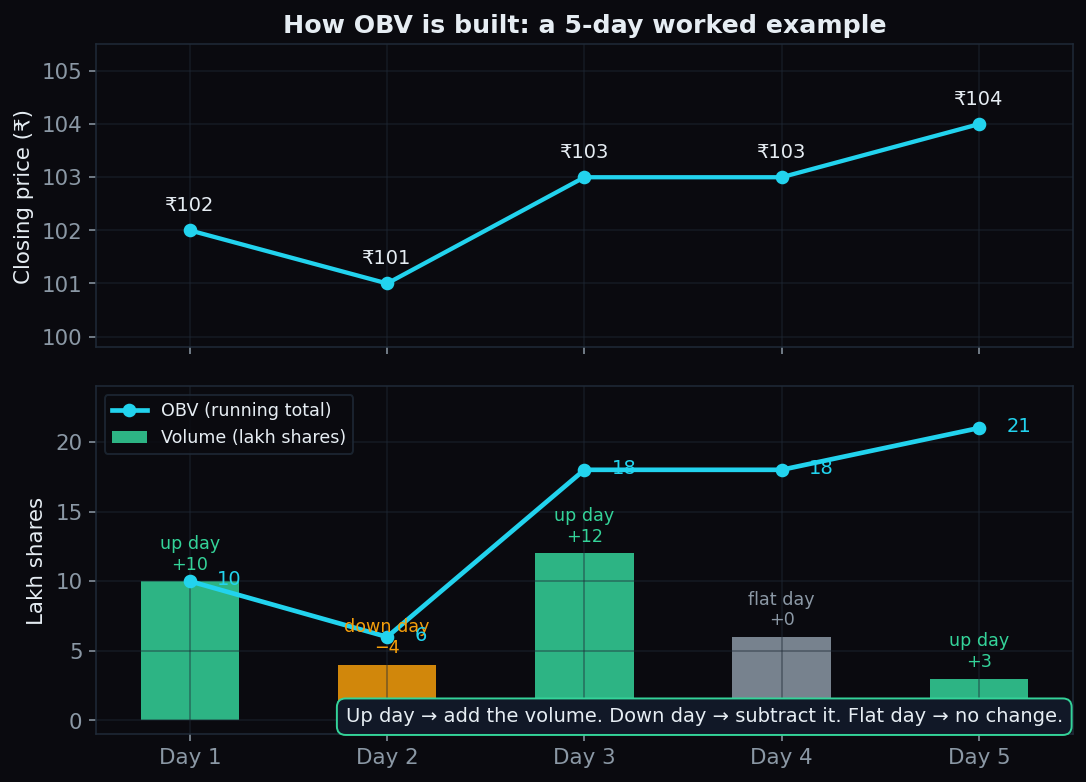
Say a stock starts at ₹100 and OBV starts at zero:
- Day 1: closes at ₹102 (up) on 10 lakh shares → OBV = 0 + 10 = 10
- Day 2: closes at ₹101 (down) on 4 lakh → OBV = 10 - 4 = 6
- Day 3: closes at ₹103 (up) on 12 lakh → OBV = 6 + 12 = 18
- Day 4: closes at ₹103 (flat) on 6 lakh → OBV stays at 18
- Day 5: closes at ₹104 (up) on 3 lakh → OBV = 18 + 3 = 21
Notice two things. The starting value is arbitrary — OBV could begin at zero or at one crore, so the absolute number means nothing. Only the direction and shape of the line matter. And while price rose four rupees over the week, OBV climbed steadily — volume, in this example, agreed with the move.
Confirmation: when volume agrees with price
The most common use of OBV is as a second opinion on a trend. A rising price with rising OBV means the up-days are consistently attracting more volume than the down-days — the crowd keeps walking in. Analysts call this confirmation.
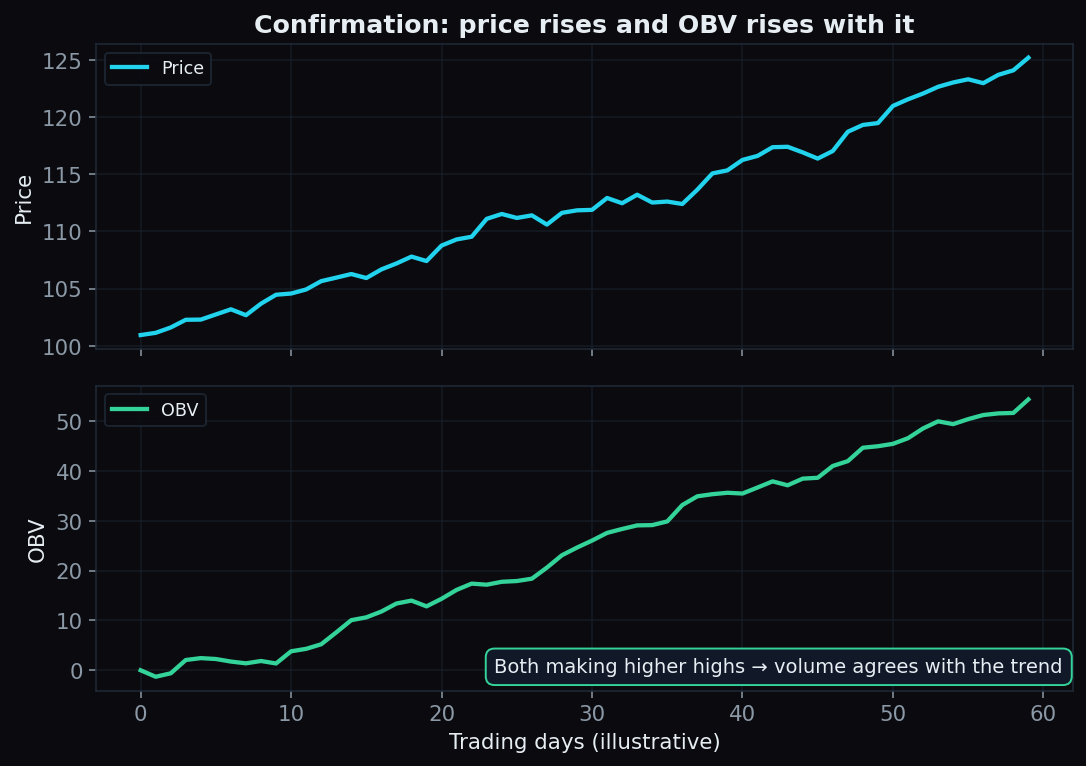
Confirmation does not predict anything by itself. It simply says the trend has participation behind it — the same information a rising price hints at, made explicit by counting volume.
Divergence: when volume disagrees
The more interesting signal is divergence — when price and OBV stop telling the same story.
In a bearish divergence, price makes a higher high but OBV makes a lower high. The second rally carried less net volume than the first: the scoreboard improved, but fewer fans showed up. In a bullish divergence, price makes a lower low while OBV makes a higher low — the pressure pushing price down is drying up even as price drifts lower.
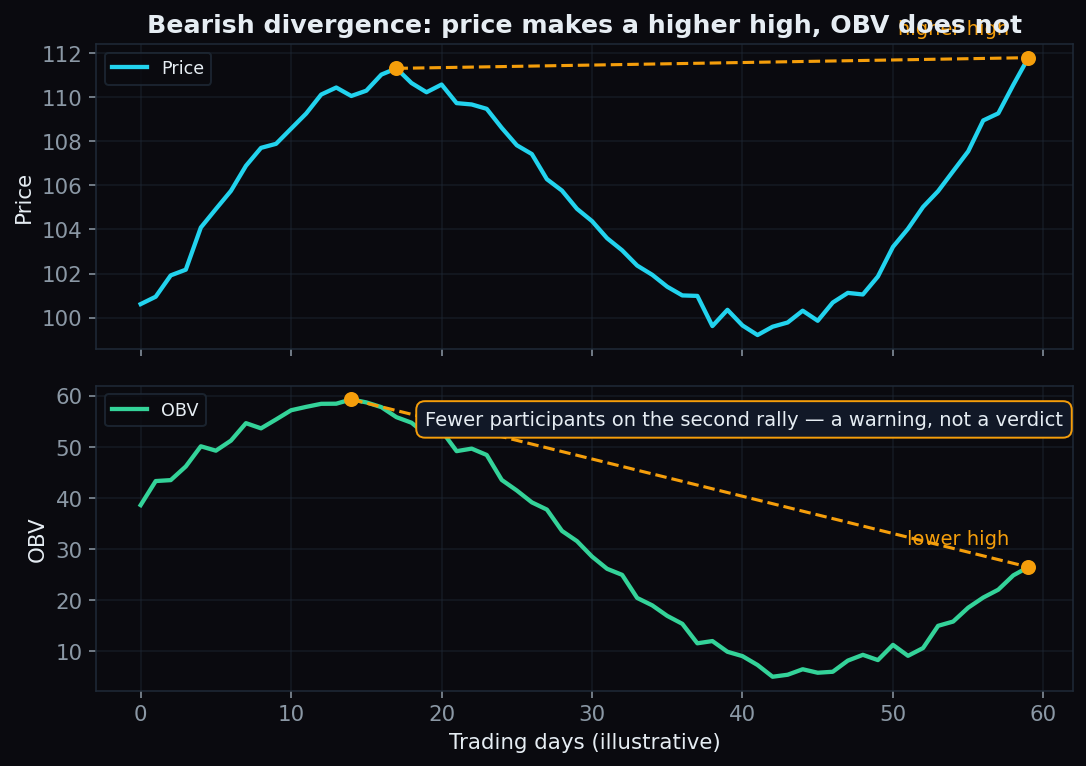
A divergence is a warning, not a verdict. It says the fuel behind a move is thinning — it does not say when, or whether, the move will actually reverse.
The honest catch
OBV is popular because it is simple. That simplicity is also its weakness:
- All-or-nothing counting. A day that closes up by just 0.05 per cent counts its entire volume on the plus side. A single closing price is a crude summary of a whole day's tug-of-war.
- One big day can distort weeks. A block deal or an index-rebalancing session can add a huge one-off volume bar that bends the OBV line for a long time, without saying anything about ordinary demand.
- No scale. OBV values cannot be compared across stocks, and there are no overbought or oversold levels like RSI has. It is shape-reading, which invites hindsight bias.
- Divergences can run for months. Price can keep making new highs on fading OBV far longer than most people expect. On its own, a divergence carries no timing information.
- Illiquid stocks mislead it. In thinly traded names, a handful of large orders dominate the volume, and OBV inherits that noise.
This is why OBV is usually read alongside price structure and other volume tools — such as volume profile or VWAP — rather than on its own.
How people read OBV in practice
Three descriptive habits show up across most textbooks:
- Slope over weeks, not wiggles over hours. The line's medium-term direction is the signal; day-to-day jitter is mostly noise.
- Compare swing highs and lows. Mark the highs and lows on price, mark the same points on OBV, and check whether the two agree.
- Trendlines on OBV itself. Granville drew support and resistance lines on the OBV line and watched for it to break before price did.
None of this makes OBV predictive on its own. It is one more witness to question — useful precisely because its testimony sometimes differs from price's.
OBV tells you whether the crowd agrees with a price move. TrueTrend does a similar job for the derivatives crowd: it turns option-chain positioning across Nifty, Bank Nifty and 12 other F&O instruments into a clear, at-a-glance read — and it scores its own track record in public. Create a free account to see today's picture.
See these concepts on live market data — free
Create a free TrueTrend account to watch daily support/resistance levels, market regime, and option-positioning charts on NIFTY, BankNifty and 12 more instruments. Every level we publish is scored on a public scoreboard — misses included. No card required.
Free forever tier · daily levels with published hit-rates across every instrument. Descriptive market structure, not investment advice.
Not ready for an account? Get the daily levels by email.
One short email each market day — the indices' call wall, put wall, gamma flip and max pain, and how the last session's levels scored. Free, no account, unsubscribe anytime.
Descriptive market structure, not investment advice. We never share your email.