Rounding Bottom Pattern Explained: The Slow U-Turn on a Chart
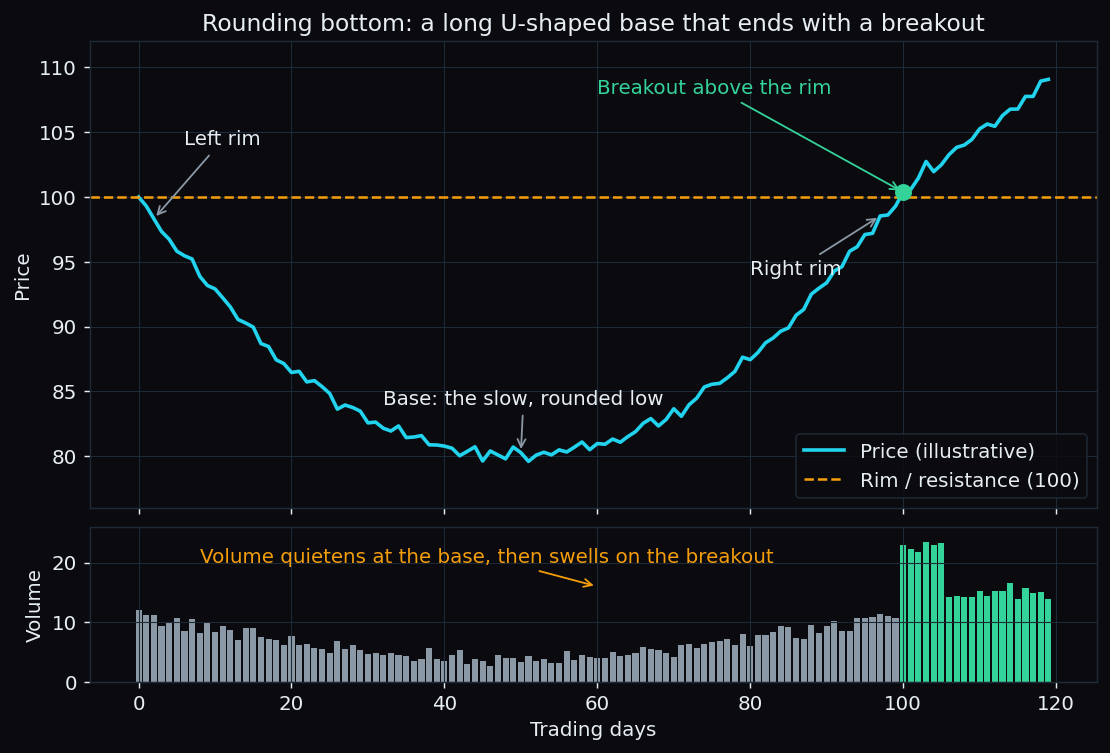
Some reversals happen in an afternoon. A rounding bottom takes months. Price drifts lower, flattens out, and then drifts higher again in a slow, saucer-shaped arc — and only at the very end, when it climbs back over the level where the slide began, does the pattern actually complete. It is one of the oldest shapes in technical analysis, and one of the easiest to spot in hindsight and hardest to trade in real time.
What exactly is a rounding bottom?
A rounding bottom (also called a saucer bottom) is a chart pattern where price traces a smooth "U" shape over a long stretch of time, then breaks above the level where the U began. It has four parts:
- Left rim — the price level where the decline starts. This becomes the line the pattern must eventually clear.
- Base — the long, gentle low. Not a sharp spike down and up, but a rounded floor where price meanders for weeks or months.
- Right rim — the slow climb back to the left rim's level. Ideally it looks like a mirror image of the decline.
- Breakout — a close above the rim. Until this happens, the pattern is only a possible rounding bottom.
A chart pattern, for anyone new to the term, is simply a recognisable shape that price draws over time. Analysts study them because the same shapes tend to appear when crowd behaviour repeats. A breakout is when price moves decisively through a level it had previously failed to cross — in this case, the rim.
An everyday analogy: turning a cargo ship
A speedboat can spin around in seconds. A loaded cargo ship cannot — it slows, swings through a wide arc, and only gradually points the other way. A rounding bottom is the cargo-ship turn. The decline loses steam, the crowd that was rushing out gradually runs out of shares to offload, and fresh demand builds so slowly that the chart never shows a single dramatic moment. That slowness is the whole point: the pattern is meant to show a gradual hand-over from supply to demand, not a panic and a snap-back.
What volume does during the pattern
Volume is the number of shares or contracts traded in a period — a rough gauge of how much activity sits behind a move. In a textbook rounding bottom, volume draws its own U that mirrors price:
- Volume is fairly high during the early decline, as holders give up.
- It fades to its quietest around the base, when nobody cares about the stock any more.
- It picks up again on the right side, and ideally swells on the breakout day.
The breakout volume is the part worth watching. A push above the rim on thin volume is a much weaker signal than one where activity clearly expands. If you want the basics of reading volume, see what trading volume tells you.
A worked example with round numbers
Say a stock trades at ₹100, then slides over three months to ₹80. It sits around ₹80 for another couple of months, then slowly recovers to ₹100 over three more months. That gives you:
- Rim = ₹100 (where the decline started and where the recovery stalls)
- Base low = ₹80
- Depth of the bowl = 100 − 80 = ₹20
Now the stock closes at ₹101, above the rim. That close is the breakout. The classic textbook measured move adds the depth of the bowl to the rim: 100 + 20 = ₹120. This is a rule of thumb for how far a completed pattern "should" carry, not a promise — it is a projection, and real markets ignore projections all the time.
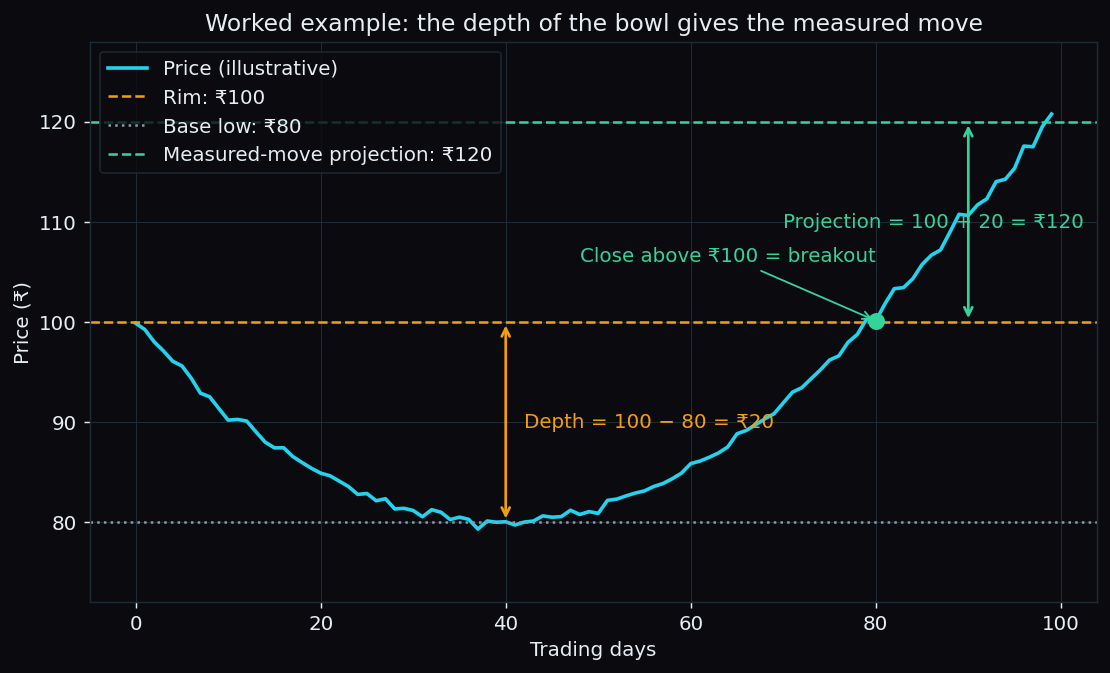
Notice how long the whole example takes: roughly eight months from left rim to breakout. Rounding bottoms are patient patterns. If you see something that looks like one forming in five trading days, it is probably just noise.
Why analysts pay attention to it
Most reversal patterns — the head and shoulders, the double bottom — have a handful of specific swing points you can pin on a chart. The rounding bottom is different: it describes a whole mood changing. The stock goes from disliked, to ignored, to quietly accumulated, to noticed again. That arc often shows up in stocks or sectors coming out of a long, boring downturn, which is why the pattern tends to be more meaningful on weekly charts than on five-minute ones.
It is also a close relative of the cup and handle. A cup and handle is essentially a rounding bottom that takes a short breather (the "handle") just under the rim before breaking out. If you can read one, you can read the other.
How it is used (described, not prescribed)
The textbook reading treats a close above the rim — preferably with expanding volume — as the moment the pattern completes. Some analysts wait for a second close above the rim, or for price to hold above it for a few sessions, to filter out one-day false starts. The rim itself often acts as a floor afterwards: a level that was resistance on the way up frequently becomes support once cleared. The measured move is used as a rough yardstick for how much room the move might have, and nothing more.
The honest catch
Three problems trip people up.
1. The pattern is only obvious afterwards. Halfway through the base, a rounding bottom looks exactly like a stock going nowhere. The right side could just as easily roll over into another leg down. There is no signal until the breakout, and by then a good chunk of the move from the base is already behind you.
2. Breakouts fail. Price pokes above the rim, draws in momentum chasers, and slides straight back into the bowl. This false start is common enough that many analysts refuse to call a rounding bottom complete on a single day's close.
3. Not every low is rounded. A sharp V-shaped low — a panic drop and an equally fast rebound — is a different animal. It reflects a shock and a relief bounce, not a slow change of mood, and the measured-move logic does not carry across.
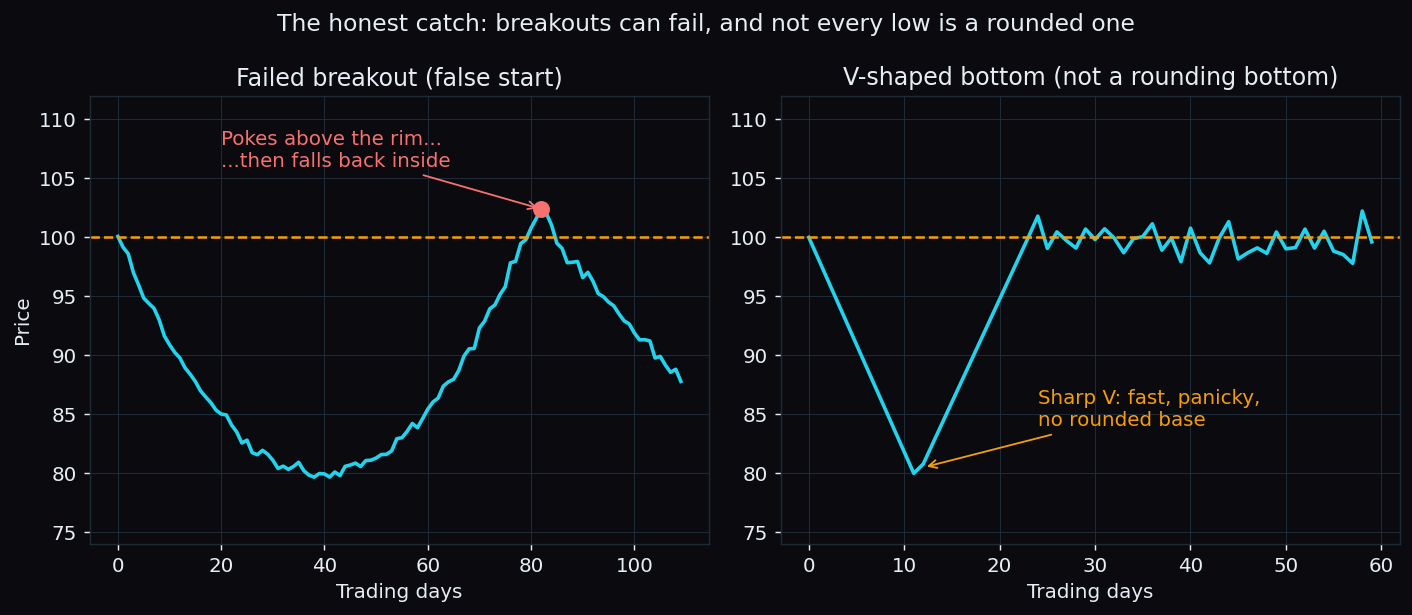
A rounding bottom describes how a crowd changed its mind slowly. It does not say the new mind is right. Treat the shape as context — a long base with expanding volume on the breakout is worth noticing — and treat the measured move as a rough sketch, never a destination.
What to take away
A rounding bottom is a long, gentle U in price, ideally mirrored by a U in volume, that completes only when price closes back above the rim. Its depth gives a rough projection for the move that follows. It is easiest to see on weekly charts and in stocks emerging from a long slump, and it is unreliable when the base is short, the breakout volume is thin, or the low is a sharp V rather than a slow arc. Chart shapes describe the past; the breakout is the first moment they say anything about the present.
Patterns show where price has been. Positioning shows where the crowd is leaning right now. TrueTrend turns that market structure — Nifty and Bank Nifty levels, F&O positioning, regime shifts — into one clear, at-a-glance read, and scores its own track record in public. Create a free account to see today's picture.
See these concepts on live market data — free
Create a free TrueTrend account to watch daily support/resistance levels, market regime, and option-positioning charts on NIFTY, BankNifty and 12 more instruments. Every level we publish is scored on a public scoreboard — misses included. No card required.
Free forever tier · daily levels with published hit-rates across every instrument. Descriptive market structure, not investment advice.
Not ready for an account? Get the daily levels by email.
One short email each market day — the indices' call wall, put wall, gamma flip and max pain, and how the last session's levels scored. Free, no account, unsubscribe anytime.
Descriptive market structure, not investment advice. We never share your email.