Trading Expectancy: The Win Rate vs Risk-Reward Math
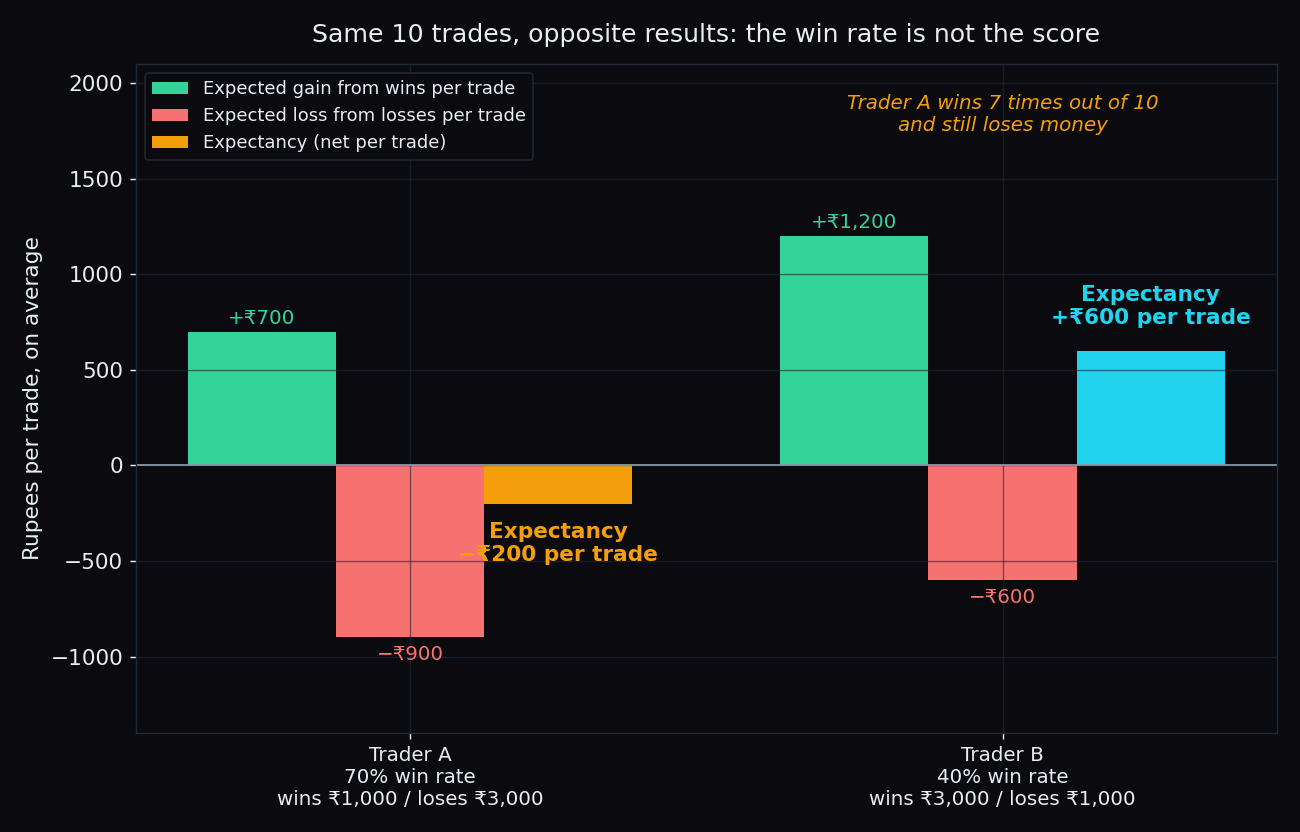
Two traders keep a diary for a month. Trader A wins 7 trades out of 10 and ends the month poorer. Trader B wins only 4 out of 10 and ends it richer. Nothing strange happened. The win rate simply is not the score. The score is a single number called expectancy: how many rupees a trade earns you on average, once wins and losses are both counted. This post shows how to work it out with round numbers, why the break-even line bends the way it does, and the honest catches the neat formula hides.
First, the words
Win rate is the share of your trades that end in a profit. Seven profitable trades out of ten is a 70% win rate. Average win is the typical profit on a winning trade. Average loss is the typical loss on a losing trade. The reward-to-risk ratio, usually written R, is the average win divided by the average loss. An average win of ₹3,000 against an average loss of ₹1,000 is R = 3. If that ratio is new to you, start with our explainer on the risk-reward ratio. Expectancy ties all three together: it is the average number of rupees you make, or lose, per trade over many trades.
The coin-game analogy
A friend offers you a game. Flip a coin. Heads, she pays you ₹3. Tails, you pay her ₹1. You will win only half the flips, yet you would happily play all day, because each flip is worth ₹1 to you on average: half of ₹3 minus half of ₹1.
A second friend offers a different game. Nine times out of ten you get ₹1. One time in ten you pay ₹20. You will “win” 90% of the rounds and feel like a genius for most of the afternoon. Each round still costs you about ₹1.10 on average, because 0.9 × ₹1 is only ₹0.90 while 0.1 × ₹20 is ₹2. The second game has the better win rate and the worse expectancy. Trading has exactly this shape.
The formula, in one line
Expectancy = (win rate × average win) − (loss rate × average loss)
The loss rate is just one minus the win rate. That is the whole thing. All the inputs come from your diary of past trades, and the formula turns them into a single rupee figure per trade.
Worked example: Trader A vs Trader B
Both traders make 10 trades.
- Trader A wins 70% of the time. Winning trades make ₹1,000. Losing trades lose ₹3,000.
- Trader B wins 40% of the time. Winning trades make ₹3,000. Losing trades lose ₹1,000.
Trader A: 0.7 × 1,000 = ₹700 expected from wins, and 0.3 × 3,000 = ₹900 expected from losses. Expectancy = 700 − 900 = −₹200 per trade. Over the 10 trades that is a loss of about ₹2,000, despite seven green days.
Trader B: 0.4 × 3,000 = ₹1,200 from wins, and 0.6 × 1,000 = ₹600 from losses. Expectancy = 1,200 − 600 = +₹600 per trade. Over 10 trades that is roughly ₹6,000, despite six red days.
Trader A’s pattern is extremely common and has a name: small wins, big losses. It usually comes from booking profits early and letting a losing trade run in the hope it recovers. We covered that habit in the disposition effect post. Trader A does not have a win-rate problem. Trader A has a size-of-loss problem.
The break-even line
Expectancy is zero when the money made on wins exactly cancels the money lost on losses. Rearranging the formula gives a neat rule: the win rate you need to break even is 1 ÷ (1 + R).
- R = 1 (you win as much as you lose): you need to win 50% of the time.
- R = 2: you need 33%.
- R = 3: you need 25%.
- R = 0.5 (wins half the size of losses): you need 67%.
- R = 0.33 (Trader A’s shape): you need 75%. A 70% win rate falls short, which is exactly why Trader A loses.
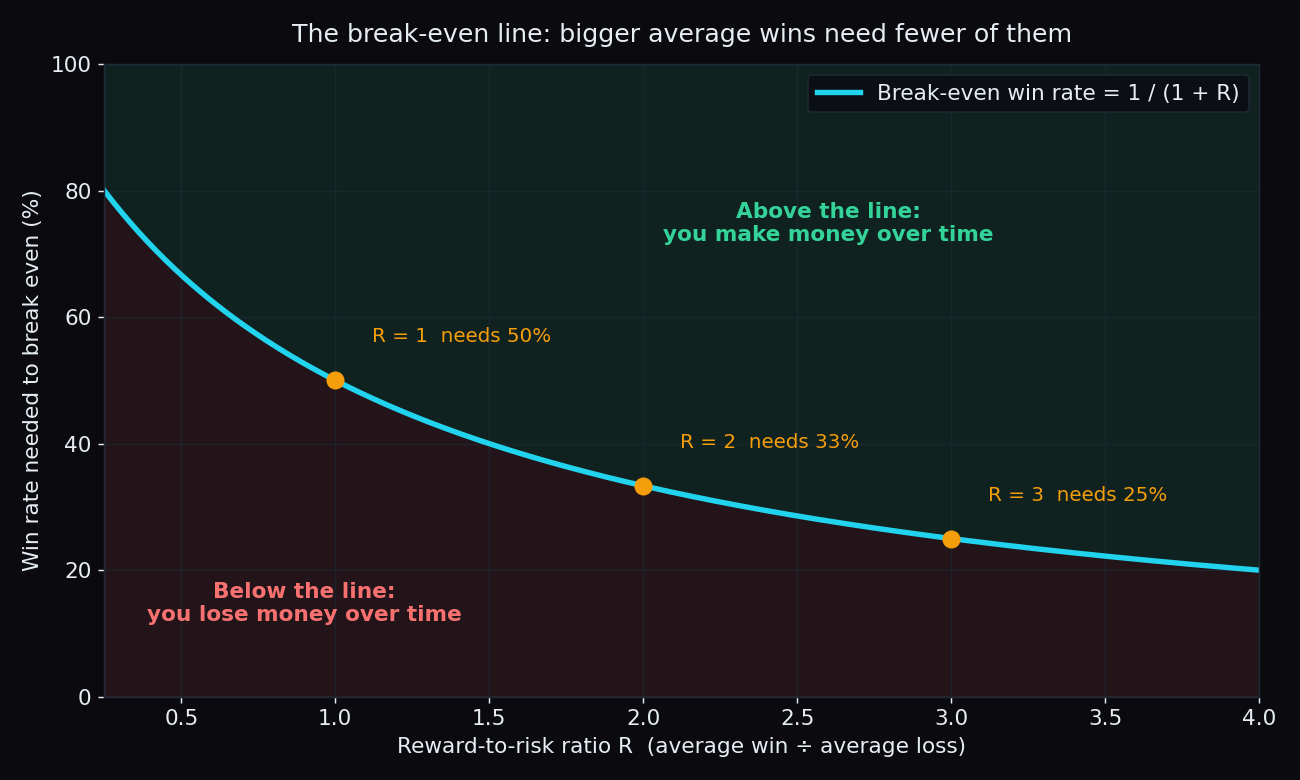
The curve is steep on the left. Shrinking your average loss from equal to your average win down to a third of it moves the break-even from 50% to 25%. That is the whole reason traders obsess over where the stop-loss sits: it sets the average loss, and the average loss sets how many wins you need.
Measuring it in R instead of rupees
Many traders express expectancy in units of risk, so the number does not change when they trade bigger or smaller. Call the amount you risk on one trade 1R. Then expectancy in R = (win rate × R) − (1 − win rate). Trader B: 0.4 × 3 − 0.6 = 0.6R per trade. In words: for every ₹1,000 risked, Trader B earns ₹600 on average. Trader A: 0.7 × 0.33 − 0.3 = about −0.07R. Position sizing, meaning how much money you put on each trade, then decides how many rupees each R represents. Our position sizing explainer covers that step.
Why a hit rate is not a win rate
This matters for anyone who reads statistics, including ours. TrueTrend’s public Scoreboard reports, for example, that the Nifty call wall held 73% of the times it was touched (n = 22) and the Nifty put wall held 61% of the time (n = 31), as of the day this post was written. Those are hit rates of a level: how often the market respected a price. They say nothing about how much was made when the level held versus how much was lost when it broke. A level can hold 73% of the time and still be a losing idea to trade if the 27% of breaks are large and fast. Turning any hit rate into a trading expectancy needs the other two numbers, average win and average loss, and those only come from a record of actual trades. That is also why we print the sample size next to every figure.
The honest catches
1. Costs are a loss on every trade
Brokerage, exchange charges, securities transaction tax and slippage (the gap between the price you wanted and the price you actually got) are paid on winners and losers alike. If a round trip costs ₹100, Trader B’s expectancy drops from ₹600 to ₹500. A system with an expectancy of ₹80 per trade before costs is a losing system after them. Always work out expectancy after costs.
2. Twenty trades tell you almost nothing
A win rate measured on 20 trades is a rough guess. If the true rate is 50%, a 20-trade sample will commonly land anywhere between about 28% and 72%. At 100 trades the honest range narrows to roughly 40% to 60%, and at 400 trades to about 45% to 55%. The same fuzziness applies to average win and average loss, which get dragged around by one or two outsized trades. A trading journal with a few hundred entries is the minimum before an expectancy figure deserves trust.
3. Positive expectancy still has ugly stretches
Trader B loses 60% of the time. The chance of five losses in a row in any given five trades is 0.6 to the power 5, which is about 8%. Across 100 trades, at least one such streak is close to certain. Five straight losses of ₹1,000 each is a ₹5,000 hole, dug by a system that is genuinely profitable. The chart below runs Trader B’s exact numbers five times with a random-number generator. Every path ends up positive, and every path has stretches that would make a real person doubt the method.
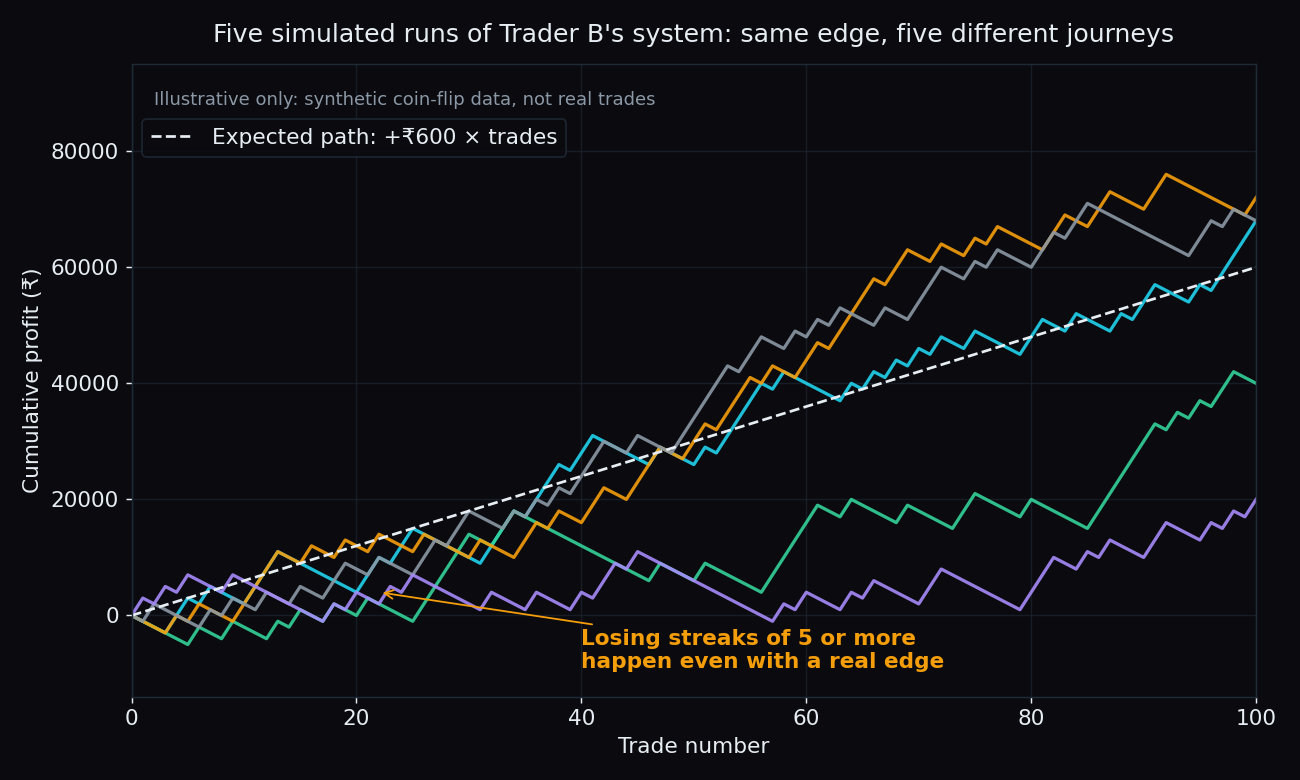
This is why expectancy and position sizing must be read together. A system can have a healthy expectancy and still wipe out an account if each trade risks too much, because the streaks arrive before the average does. Our post on drawdown math shows how hard it is to climb back from a deep hole.
4. The inputs drift
Win rate and average win are not fixed properties of a strategy. They change with volatility (how much prices swing), with the market’s overall mood, trending or range-bound, and with your own discipline. An expectancy measured in a trending year can turn negative in a choppy one. Recompute it on a rolling window rather than once.
What to do with the number
The lesson is not “chase a high win rate” or “chase a high R”. Both can work, at different points on the curve. What hurts accounts is sitting below the line without knowing it, which is easy, because a 70% win rate feels wonderful. Work out your own inputs from your last few hundred trades, after costs, and place yourself on the chart. A trader who knows their expectancy is +0.3R can size trades calmly and sit through a losing streak. A trader who only knows their win rate is guessing.
Key takeaway: Expectancy = (win rate × average win) − (loss rate × average loss). The break-even win rate is 1 ÷ (1 + R). A 70% win rate loses money when losses are three times the size of wins, and a 40% win rate makes money when wins are three times the size of losses. The win rate is not the score. The rupees per trade are.
TrueTrend scores its own market-structure reads in public, with the sample size printed next to every number, so you see the hit rate and the miss rate side by side instead of a highlight reel. Start with TrueTrend for the same at-a-glance read across Nifty, Bank Nifty and F&O.
See these concepts on live market data — free
Create a free TrueTrend account to watch daily support/resistance levels, market regime, and option-positioning charts on NIFTY, BankNifty and 12 more instruments. Every level we publish is scored on a public scoreboard — misses included. No card required.
Free forever tier · daily levels with published hit-rates across every instrument. Descriptive market structure, not investment advice.
Not ready for an account? Get the daily levels by email.
One short email each market day — the indices' call wall, put wall, gamma flip and max pain, and how the last session's levels scored. Free, no account, unsubscribe anytime.
Descriptive market structure, not investment advice. We never share your email.