Volatility Risk Premium: Why Option Writing Pays on Average, and When It Doesn't
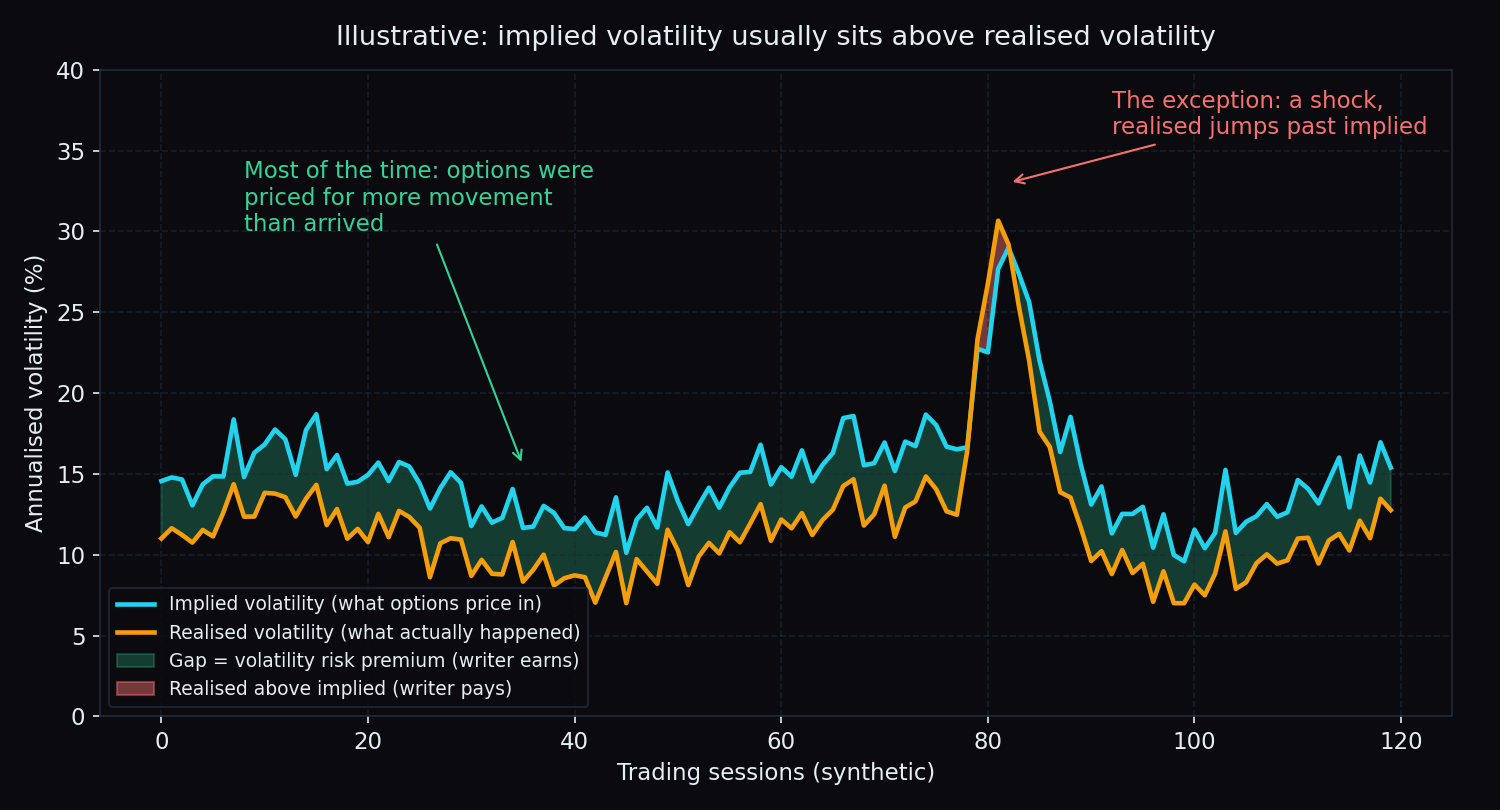
Here is a number from our own archive. Across 90 Nifty sessions between April and September 2026, the volatility priced into at-the-money options at the close was higher than the volatility that actually arrived over the next five sessions in 78 of them. That is 87% of the time. Options, on average, were priced for more movement than the market delivered. The gap has a name: the volatility risk premium. This post explains what it is, why it exists, why it makes option writing profitable on average, and, just as important, the weeks when it goes badly wrong.
Two definitions first
Implied volatility (IV) is the amount of movement an option’s price is “expecting”. It is quoted as an annual percentage. An IV of 12% on Nifty roughly means the option is priced for the index to move about 12% over a year, which works out to about 0.75% on a typical day. (Full explainer: implied volatility explained.)
Realised volatility is how much the index actually moved, measured after the fact from its daily closes, and expressed the same way so the two can be compared.
Put them side by side and you get one of the most consistent patterns in options markets anywhere in the world: implied volatility is usually higher than the realised volatility that follows. The difference is the volatility risk premium, often shortened to VRP.
The analogy: options are insurance, and insurers charge extra
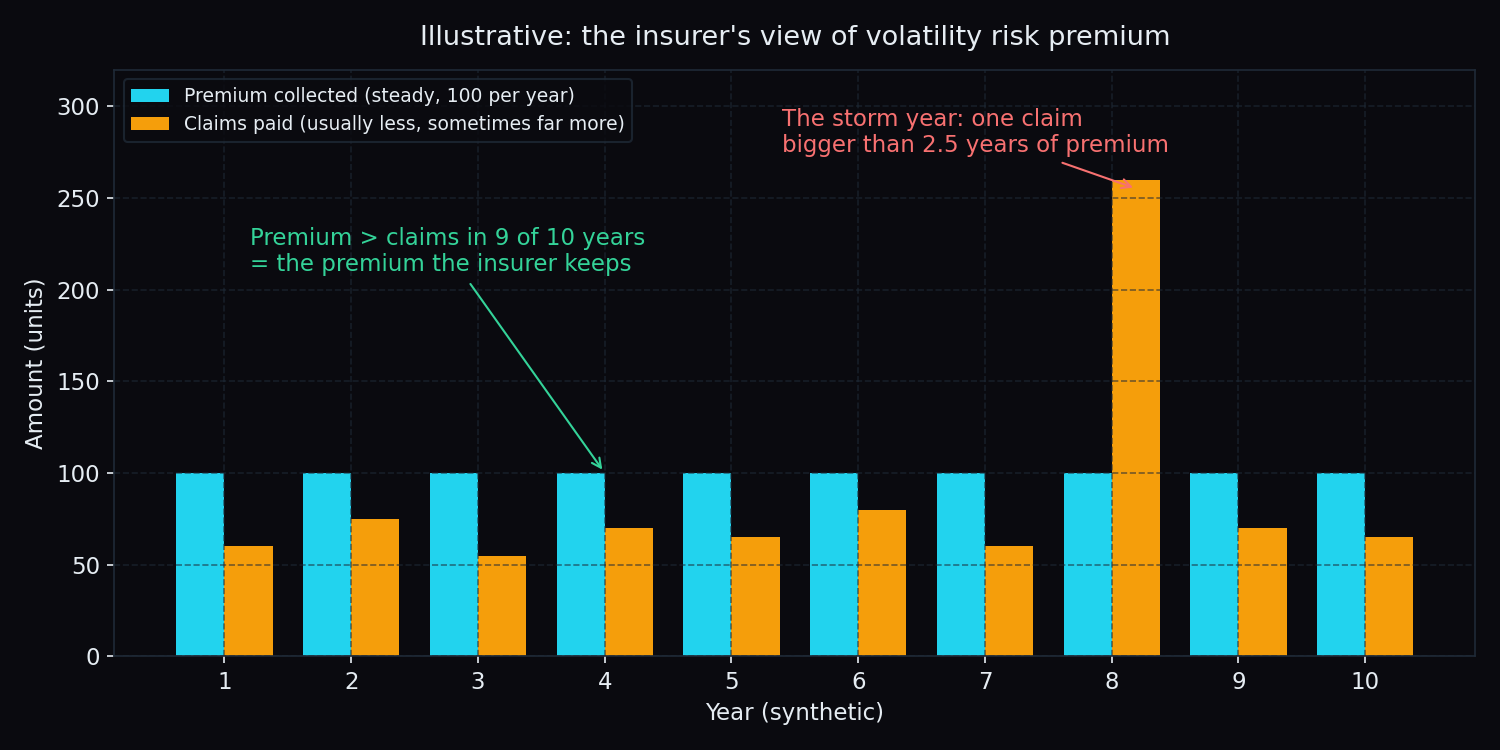
Think about car insurance. An insurer collects a fixed premium from you every year. Most years, your claims are smaller than the premium, so the insurer keeps the difference. Every so often there is a storm, and one year’s claims are bigger than several years of premium put together.
The insurer stays in business because it charges more than the mathematically fair price. That extra is the price of certainty for you and the reward for carrying the storm risk for them. Nobody calls this a scam. It is what makes protection available at all.
An option writer is playing the insurer. The option holder pays a premium for protection against a big move (or for a shot at a big gain). The writer collects the premium and carries the risk. The volatility risk premium is the option market’s version of that “extra”: on average, holders pay a bit more than the movement turns out to be worth.
Why the premium exists at all
If option prices were “fair”, implied and realised volatility would match on average and nobody would earn anything for writing. Three things push implied above realised.
- Fear is asymmetric. Crashes are fast and rallies are slow. Fund managers, pledged-share promoters and anyone with a large equity book are willing to overpay for puts because a crash hurts far more than a missed rally helps. That demand lifts the price of protection above its fair value.
- Writers demand pay for an ugly risk shape. The writer’s gains are capped at the premium; the losses are not capped at anything. Nobody carries that risk for a fair price. They want a margin of safety built in, and the market gives it to them.
- Not everyone can write. Writing options ties up serious margin (see SPAN and exposure margin for option writers). With fewer people able to supply protection than want to hold it, the price stays a little rich.
A worked example with round numbers
Say Nifty is at 24,000 and the at-the-money straddle for the week (one call plus one put at the 24,000 strike) costs 240 points, or 1% of the index. That price says the market is braced for roughly a 1% move by expiry, in either direction. (More on this: how option prices set the expected move.)
- A typical week. The index closes the week 150 points from 24,000. One leg of the straddle finishes 150 points in the money, the other finishes worthless. The writer collected 240 and pays out 150, keeping 90 points.
- A quiet week. The index closes 60 points away. The writer keeps 180 points.
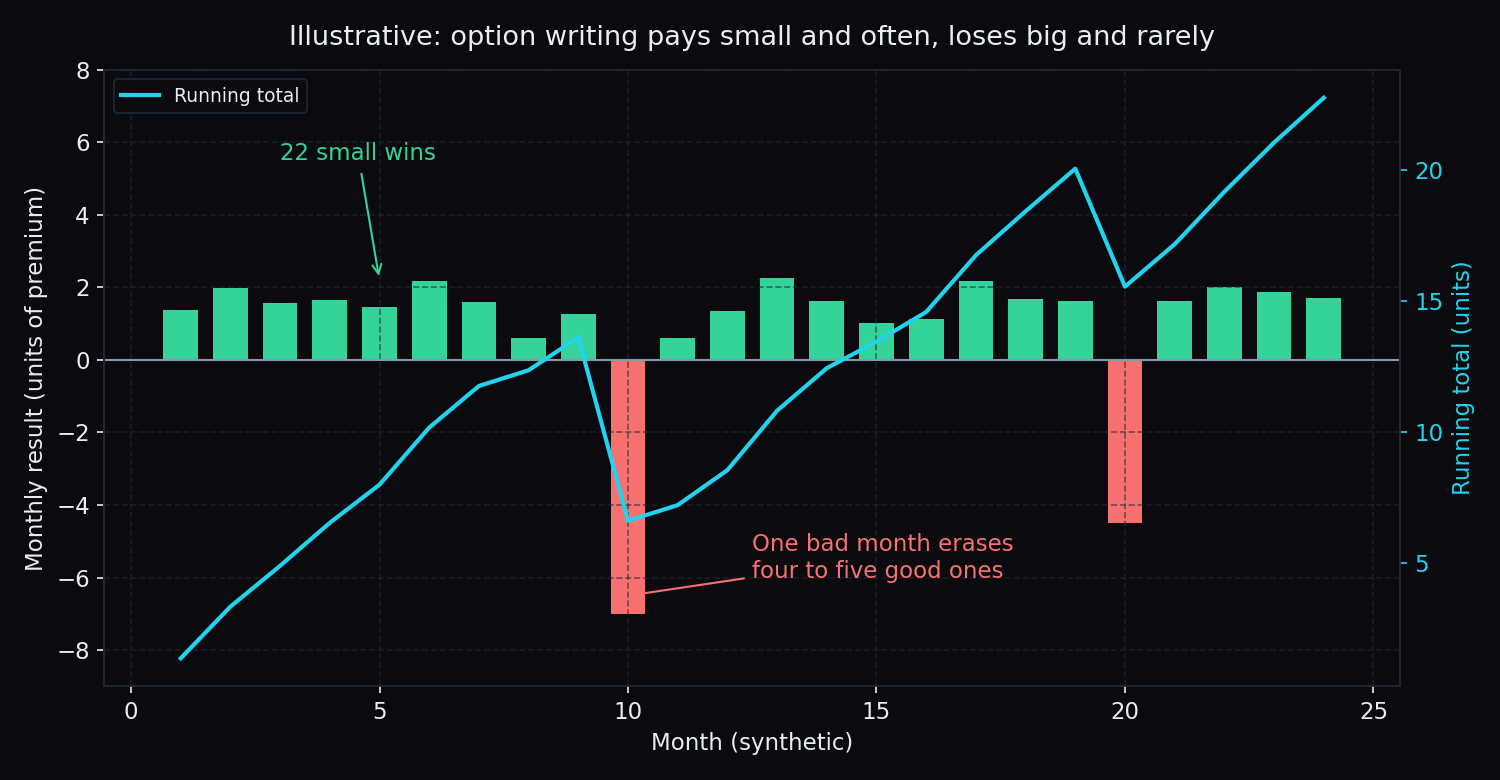
- A shock week. A surprise policy decision or a global slide moves the index 600 points. The writer collected 240 and pays out 600, a loss of 360 points: four typical weeks of gains, gone in one.
Now imagine 24 such weeks. If 22 of them look like the first two and two look like the third, the writer still ends up ahead, but only just, and only if they survived the two bad weeks with enough capital to keep going. That is the entire volatility risk premium in one picture: small, frequent gains paid for by rare, large losses.
What our own data says
TrueTrend stores a snapshot of the Nifty and Bank Nifty option chain at about 15:15 IST every session, including the at-the-money implied volatility of the nearest expiry. We took each day’s reading and compared it with the realised volatility of the next five sessions (about one trading week), calculated from close-to-close moves. Sessions where the nearest contract was expiring that same afternoon were excluded, because a contract with two hours left carries no meaningful volatility reading. Period: 20 April to 24 September 2026.
- Nifty (n=90 sessions): average implied volatility 12.9%, average realised volatility over the following week 8.6%. Implied was above realised in 78 of 90 sessions (87%). The average gap was 4.3 volatility points.
- Bank Nifty (n=101 sessions): average implied 15.4%, average realised 11.7%. Implied was above realised in 82 of 101 sessions (81%). Average gap 3.8 points.
So over this sample the premium was real and large: options were priced for between a third and a half more movement than arrived. But look at the other side of the number. In 12 Nifty sessions and 19 Bank Nifty sessions, realised volatility came in above implied. And those misses were not spread evenly. The three worst Nifty readings all came from a single cluster, 2 to 6 July 2026, when the closing IV was between 8.5% and 10.4% and the week that followed realised between 16% and 18%. Realised volatility was about double what options had priced. A writer who had been collecting a comfortable premium for weeks gave a large slice of it back in five sessions.
The same lesson appears on our public Scoreboard, which grades the strikes where writers are most concentrated (the “walls”) against what the index does next. Right now the Nifty call wall has held when touched 75% of the time (n=20 touches) and the Nifty put wall 61% (n=31 touches); on Bank Nifty the figures are 64% (n=14) and 62% (n=13). The most heavily written strikes on the chain still give way roughly one touch in three. Writers are usually right, and usually is not always.
When it doesn’t pay
The premium is an average. Averages describe a long sequence of outcomes, not the next one. Four situations turn a paying strategy into a losing one.
1. A shock arrives that options were not priced for
The July 2026 cluster above is the textbook case. Implied volatility was low going in, which made the premium look thin but safe. Then the market moved twice as much as priced. The cheapest-looking weeks to write are often the ones with the least cushion.
2. Position size assumes the average will show up on time
A writer earning 90 points a week on average who is sized so that a 600-point week costs them half their capital does not get to enjoy the average. They get the drawdown maths instead: a 50% loss needs a 100% gain to recover. The premium pays the survivors; it does not care who they are.
3. Costs eat a thin premium
When implied volatility is low, the premium on offer is small in rupee terms. Brokerage, STT, exchange charges and slippage do not shrink to match (see the real cost of one trade). A strategy that earns 4 volatility points on paper can earn close to nothing after costs on a small account.
4. The premium is not evenly distributed to everyone who writes
SEBI’s own study found that about 93% of individual F&O traders lost money between FY22 and FY24 (our summary of the study). If option writing paid the average to everyone, that number would be impossible. The premium exists in the market as a whole. It reaches a particular account only if that account survives the bad weeks, keeps costs low, and does not abandon the approach right after the first big loss.
The honest catch
- Five months is a short sample. Our 90-session window covers no full-blown crisis. Over a longer history the average premium is still positive, but the worst weeks are far worse than the July 2026 episode.
- Realised volatility from daily closes understates intraday swings. A day that falls 1.5% and recovers by the close counts as calm in our method but was anything but calm for a writer watching their margin.
- “On average” is doing a lot of work. The premium is skewed: many small wins, few large losses. Any strategy with that shape looks brilliant right up to the week it does not.
- This is structure, not a plan. Knowing the premium exists says nothing about which strike, which expiry, or whether any of it suits your situation.
Key takeaway: Option holders pay a bit more than movement turns out to be worth, and writers collect that difference, but only on average and only if they survive the weeks when realised volatility runs past implied. In our data that was 13% of Nifty sessions and 19% of Bank Nifty sessions, clustered into short, violent stretches.
Want to see whether today’s implied volatility looks rich or thin without building the spreadsheet yourself? TrueTrend turns the option chain into a clear, at-a-glance read of positioning and volatility across Nifty, Bank Nifty and F&O stocks, with every level scored in public. Create your TrueTrend account.
See these concepts on live market data — free
Create a free TrueTrend account to watch daily support/resistance levels, market regime, and option-positioning charts on NIFTY, BankNifty and 12 more instruments. Every level we publish is scored on a public scoreboard — misses included. No card required.
Free forever tier · daily levels with published hit-rates across every instrument. Descriptive market structure, not investment advice.
Not ready for an account? Get the daily levels by email.
One short email each market day — the indices' call wall, put wall, gamma flip and max pain, and how the last session's levels scored. Free, no account, unsubscribe anytime.
Descriptive market structure, not investment advice. We never share your email.