ASM and GSM Explained: NSE's Surveillance Frameworks
A small company’s share goes from ₹100 to ₹300 in six weeks. Its profits have not changed. One morning your broker app shows a warning next to the stock: 100% margin, delivery only, 5% price band. Nothing has been banned. The exchange has simply put the stock under surveillance. NSE and BSE run two main frameworks for this, called ASM and GSM. This post explains what each one is, what triggers it, what it does to your order, and the honest limits of reading anything into it.
First, the words
Surveillance is the exchange watching trading for patterns that look unhealthy, such as a price running far ahead of what the company earns. A price band is the maximum a stock is allowed to move in a day; if the band is 5%, a ₹100 stock cannot trade above ₹105 or below ₹95 that session. Our explainer on circuit breakers and price bands covers the normal bands. Margin is the money your broker must collect from you before a trade; 100% margin means you pay the full value up front, with no leverage at all. Trade-for-trade (often written T2T) means every trade must result in actual delivery of shares, so you cannot purchase in the morning and square off the same afternoon. An Additional Surveillance Deposit (ASD) is extra cash the exchange blocks on top of the trade value, on the purchase side, and returns later. Fundamentals are the company’s financial facts: net worth, fixed assets, earnings, and the price-to-earnings ratio.
The traffic analogy
Think of a stock as a road. The exchange is the traffic authority. It almost never closes a road. Instead, when something looks unsafe, it adds speed bumps, lowers the speed limit, or charges a refundable toll deposit at the gate. Cars can still pass. They just pass slower, and the reckless ones lose interest.
GSM and ASM are two different reasons to add bumps. GSM is for a road in bad repair: the company’s fundamentals are weak, yet its price is high, so the surface does not justify the speed. ASM is for a road in fine repair where the traffic itself is behaving strangely: sudden bursts of speed, a handful of drivers doing most of the driving, or volumes that jumped out of nowhere.
GSM: the Graded Surveillance Measure
GSM was introduced by SEBI together with the exchanges in 2017. The word to notice is graded. It is a ladder. A stock enters at the bottom and climbs a stage each time the price keeps behaving oddly at a review, and comes back down when it calms.
The shortlist is built from financial screens rather than opinions. Broadly, a company gets picked up when its share price is out of line with its net worth and net fixed assets, and its market capitalisation is small. Stocks that have derivatives contracts are excluded, because the futures and options segment has its own controls.
What the ladder does, from the bottom up:
- Trade-for-trade with a 5% price band. No intraday squaring off, and the daily move is capped.
- A deposit of 100% of the trade value is collected from whoever purchases the shares, on top of paying for the shares. The exchange holds it and returns it later.
- Trading is permitted only once a week, on a single fixed day.
- The deposit rises to 200% of the trade value.
- Trading is permitted only once a month.
- Monthly trading with no upward price movement allowed. The stock can only stay flat or fall on that day.
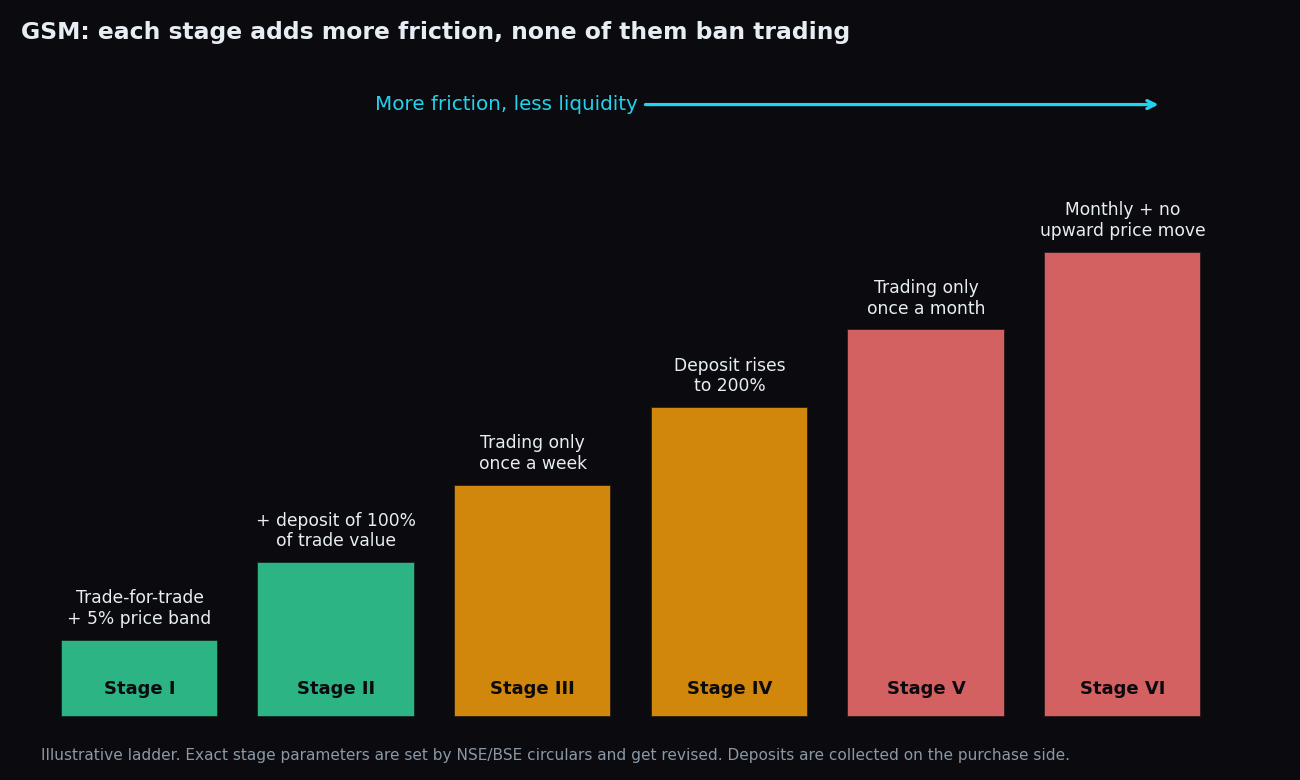
Stage reviews happen periodically, usually each quarter. The exact stage parameters live in NSE and BSE circulars and have been revised more than once, so check the exchange’s surveillance page for the current table before relying on any one number here.
ASM: the Additional Surveillance Measure
ASM came in 2018 and looks at behaviour rather than balance sheets. The exchanges, jointly with SEBI, run objective screens on things like:
- How much the price has moved close-to-close and high-to-low over recent weeks and months.
- Whether a small number of clients account for most of the trading (client concentration).
- How much volume has jumped compared with its own history.
- The share of trades that end in actual delivery, the number of unique investors trading it, and its price-to-earnings ratio and market cap.
ASM comes in two flavours. Short-term ASM is for a sudden burst: the stock gets stepped-up margins for a short spell, and the list is reviewed every few trading sessions. Long-term ASM is for a sustained pattern: the stock moves to 100% margin, and in later stages also gets trade-for-trade settlement and a 5% price band, with stage reviews at set intervals. A stock that enters long-term ASM stays for a minimum period before it can exit.
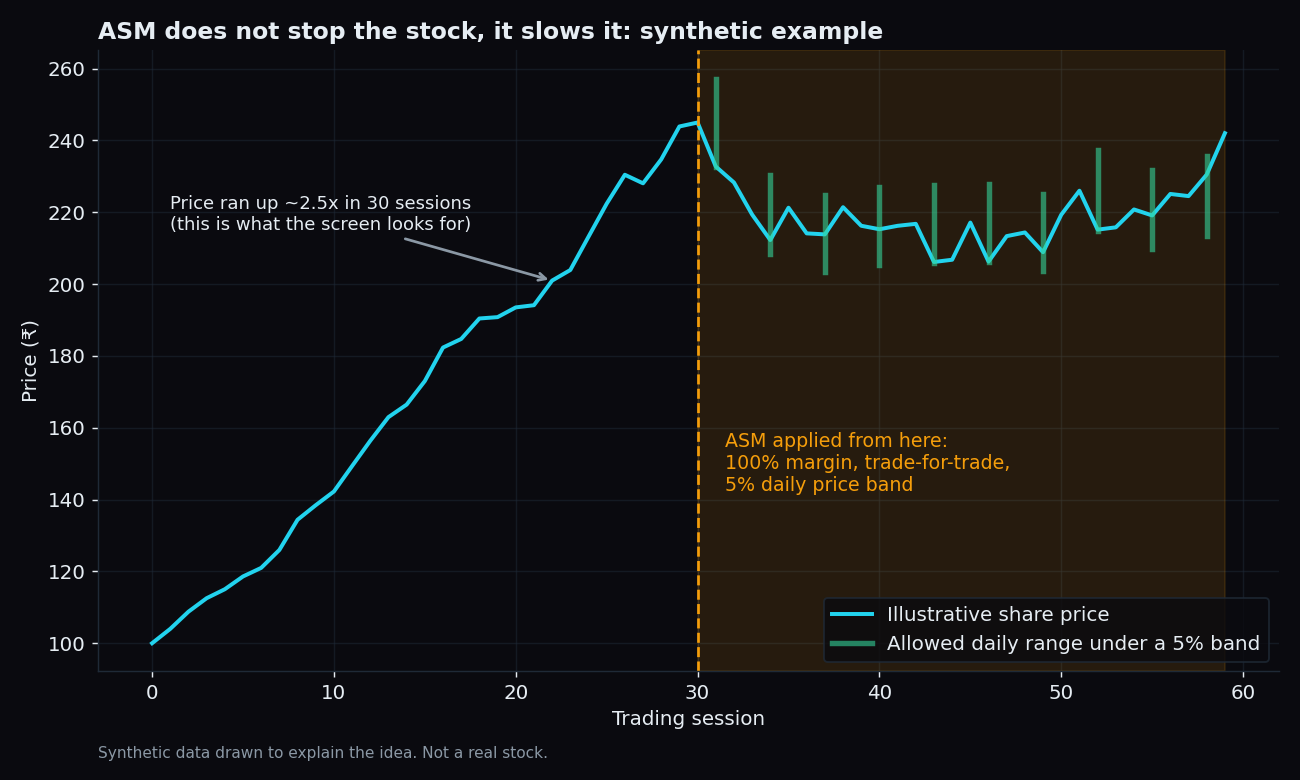
Notice what the chart shows and does not show. ASM did not stop the price. It removed leverage, removed intraday flipping, and put a lid on how far the stock can move in one session. The traffic keeps flowing, slower.
Worked example: the same trade under three rules
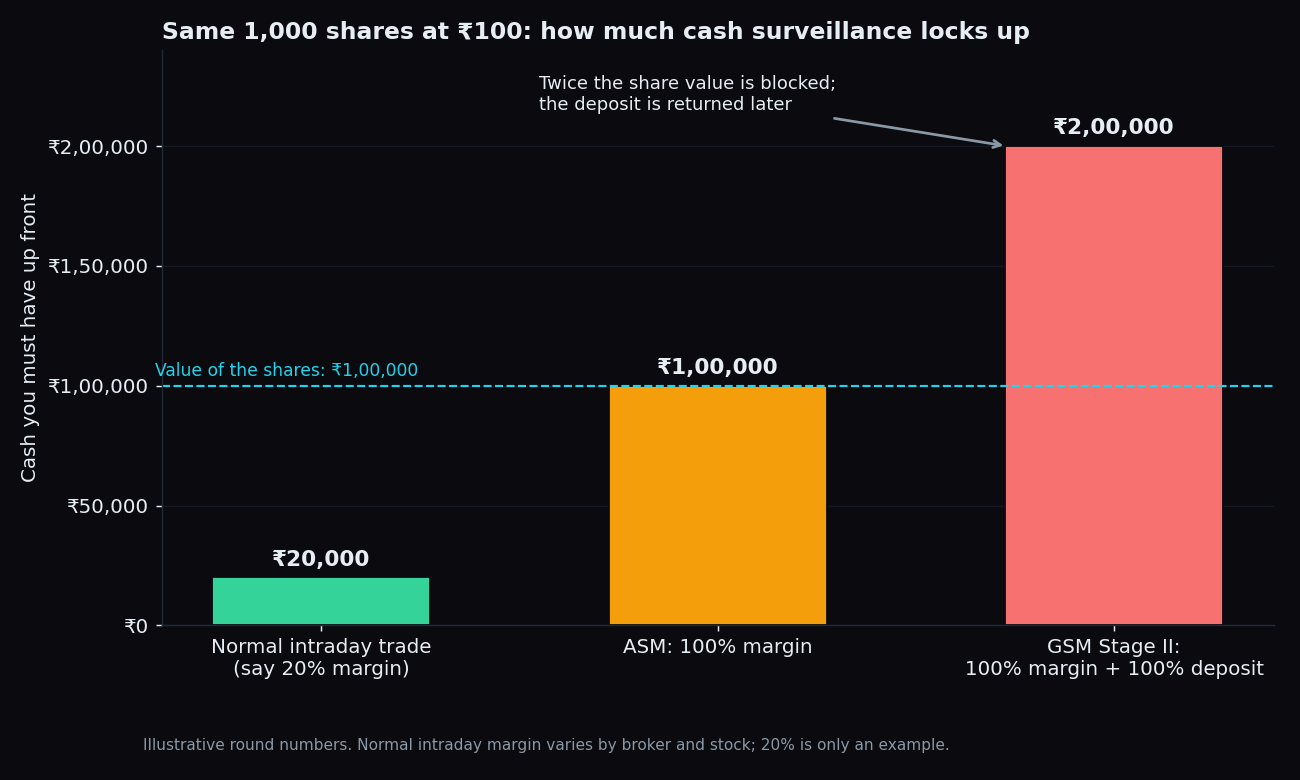
Say a stock trades at ₹100 and you want 1,000 shares, worth ₹1,00,000.
- Normal intraday trade. Depending on your broker and the stock, you might need roughly 20% up front, so about ₹20,000, and you can square off before the close. Read margin and leverage explained for why brokers allow that.
- Under ASM with 100% margin and trade-for-trade. You must have the full ₹1,00,000 in your account. The shares are delivered to your demat account, which under T+1 settlement means the next working day, and you can only dispose of them after that. No same-day exit.
- Under GSM Stage II. Everything above, plus a deposit of 100% of the trade value, another ₹1,00,000, blocked with the exchange. You now have ₹2,00,000 tied up to hold ₹1,00,000 of shares. The deposit comes back later, but not that week.
The 5% band changes the maths of a run-up too. At 5% a day, a ₹100 stock needs 14 straight upper-circuit sessions just to reach about ₹198. A stock with a normal 20% band could do the same in four. That is the whole point: the framework makes a frenzy slow and expensive.
ASM vs GSM at a glance
- What it looks at. GSM: price versus fundamentals (net worth, assets, earnings, market cap). ASM: price behaviour, volume, delivery share and client concentration.
- Who it tends to catch. GSM: small, thinly traded companies with weak financials and a high price. ASM: any stock, including well-known names, that has had a sudden or sustained sharp move.
- What it does. Both use 100% margin, trade-for-trade and a 5% band. Only GSM adds the refundable deposit and, in higher stages, restricts trading to one day a week or a month.
- How long. Short-term ASM can be days. Long-term ASM and GSM are reviewed at set intervals and can run for a quarter or more.
- Where it applies. Both frameworks are applied jointly by NSE and BSE, so a stock under ASM on one exchange is under ASM on the other.
There is a third, newer sibling for very small companies called the Enhanced Surveillance Measure (ESM), which uses similar tools plus periodic call auctions. Same idea, aimed at the smallest names by market cap.
How it shows up for you
The exchanges publish the surveillance lists on their websites after market hours, and the measure applies from a date stated in the circular, usually within a couple of sessions. Your broker mirrors it: the stock gets a tag in the app, intraday product types disappear for it, and orders outside the band are rejected. If you already hold the shares, nothing is taken from you. You simply face the same delivery-only rules and the 5% band on the way out, and if the stock is in a weekly or monthly GSM stage, you may have to wait for the next permitted day to trade it. Liquidity thins sharply, so the bid-ask spread usually widens too.
The honest catch
Surveillance is not a verdict. A stock in ASM has not been found guilty of anything; it has tripped a rule-based screen, and plenty of ordinary companies pass through short-term ASM after a results day or a big news event. Equally, a stock not in ASM or GSM has not been certified clean. The screens are backward-looking and mechanical: they react to price and volume that already happened.
The frameworks also change. SEBI and the exchanges have revised stage parameters, review timings and criteria more than once since 2017, and this post describes the shape of the system rather than the current rulebook. When a specific stock matters to you, the primary source is the NSE or BSE surveillance page and the circular naming that stock.
Key takeaway: GSM is for stocks whose price has run far ahead of weak fundamentals; ASM is for stocks whose trading behaviour has turned unusual. Neither bans trading. Both remove leverage (100% margin), force delivery (trade-for-trade) and cap the daily move (5% band), and GSM adds a refundable deposit and, at higher stages, trading on only one day a week or month. It is a speed bump, not a judgement.
TrueTrend turns market structure like this into a clear, at-a-glance read across Nifty, Bank Nifty and F&O, and scores its own market-structure reads in public with the sample size shown next to every number. Start with TrueTrend and see the track record for yourself.
See these concepts on live market data — free
Create a free TrueTrend account to watch daily support/resistance levels, market regime, and option-positioning charts on NIFTY, BankNifty and 12 more instruments. Every level we publish is scored on a public scoreboard — misses included. No card required.
Free forever tier · daily levels with published hit-rates across every instrument. Descriptive market structure, not investment advice.
Not ready for an account? Get the daily levels by email.
One short email each market day — the indices' call wall, put wall, gamma flip and max pain, and how the last session's levels scored. Free, no account, unsubscribe anytime.
Descriptive market structure, not investment advice. We never share your email.