Bear Put Spread vs Bear Call Spread: A Worked Example
Options are not only for betting on a rise. When a trader expects an index to fall — or simply to stop rising — there are two classic ways to express that view with strictly limited risk: the bear put spread and the bear call spread. They sound like twins, and their payoffs are near mirror images, but one pays money upfront and the other collects it. This post builds both, step by step, using one illustrative example with simple round numbers. Nothing here is a recommendation — the strikes and premiums are made up to teach the mechanics.
The building blocks, in one minute
- A call option gives its buyer the right to buy at a fixed price (the strike). It gains value when the market rises above the strike.
- A put option gives its buyer the right to sell at the strike. It gains value when the market falls below the strike.
- The premium is the price of that right — what the buyer pays and the seller collects. New to this? Start with calls and puts and how premiums work.
- A spread means holding two options of the same type at once: one bought, one sold, different strikes. The sold leg partly pays for — or insures — the bought leg.
An everyday analogy: full accident insurance for a car is expensive. If you accept a payout cap — the insurer covers damage only up to a limit — the premium drops sharply. A spread is exactly that deal in option form: you give up the unlimited part of the payoff, and in exchange the position becomes much cheaper (or even pays you upfront). Cheaper cover, capped payout.
Bear put spread: pay now, profit if the fall arrives
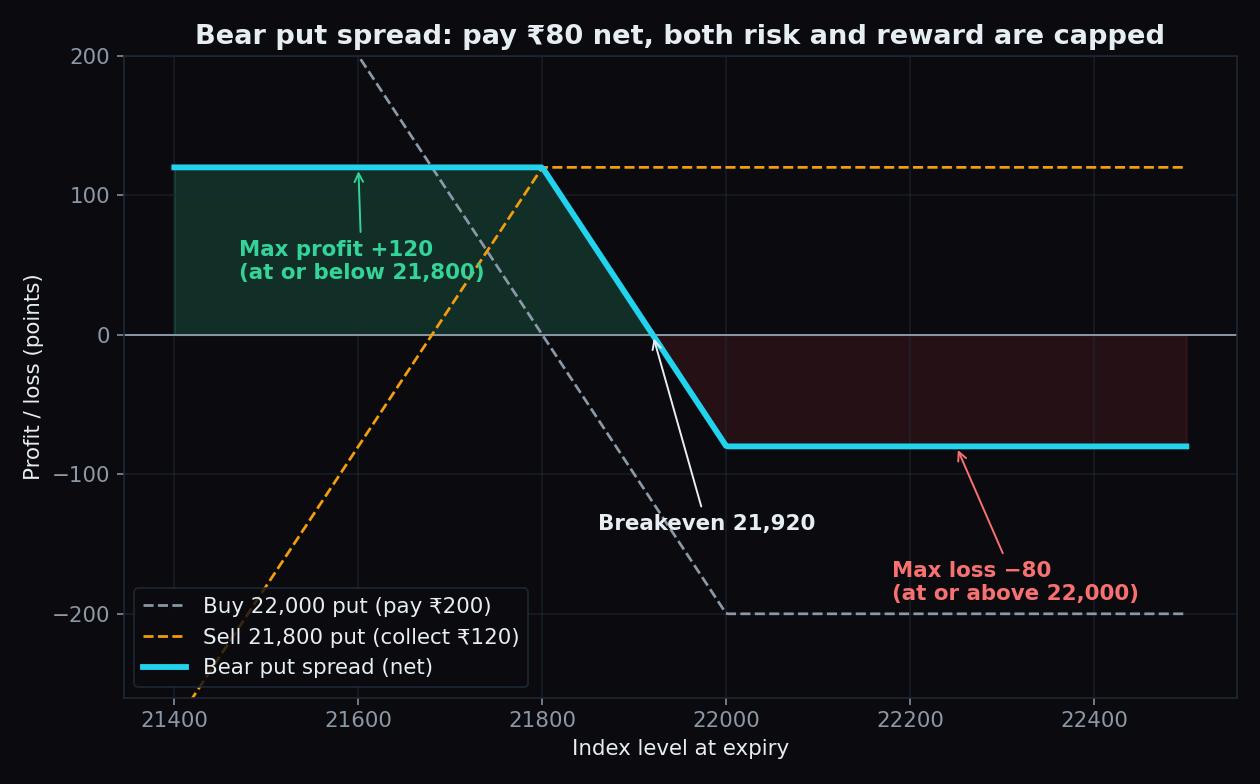
Suppose an index trades at 22,000 and a trader expects a dip toward 21,800 by expiry. An illustrative bear put spread:
- Buy the 22,000 put for a premium of ₹200 (this leg profits if the market falls).
- Sell the 21,800 put and collect ₹120 (this leg gives away the profit below 21,800).
Net cost = 200 − 120 = ₹80 per unit. Because money leaves the account on day one, this is called a debit spread. Now the three numbers that define the trade at expiry:
- Max profit = 120 points. The gap between strikes (22,000 − 21,800 = 200) minus the 80 paid. Earned anywhere at or below 21,800.
- Max loss = 80 points — the premium paid, lost anywhere at or above 22,000. It can never be worse.
- Breakeven = 21,920, i.e. 22,000 minus the 80 paid. The market must actually fall for this trade to work.
Compare that with buying the 22,000 put alone: it costs the full ₹200, so the market must drop below 21,800 just to break even. The spread accepts a capped reward in exchange for a much lower cost and a closer breakeven. (Its bullish mirror image is the bull call spread.)
Bear call spread: collect now, keep it if the market stays down
Same market, same view, opposite construction — this time with calls:
- Sell the 22,000 call and collect ₹200 (this leg profits if the market does not rise above 22,000).
- Buy the 22,200 call for ₹120 (this leg is the insurance that caps the damage if the market rallies instead).
Net receipt = 200 − 120 = ₹80 per unit, collected upfront — a credit spread. At expiry:
- Max profit = 80 points — the credit received, kept in full anywhere at or below 22,000. The market does not need to fall; it only needs to not rise.
- Max loss = 120 points. The 200-point strike gap minus the 80 collected, hit anywhere at or above 22,200.
- Breakeven = 22,080, i.e. 22,000 plus the 80 collected.
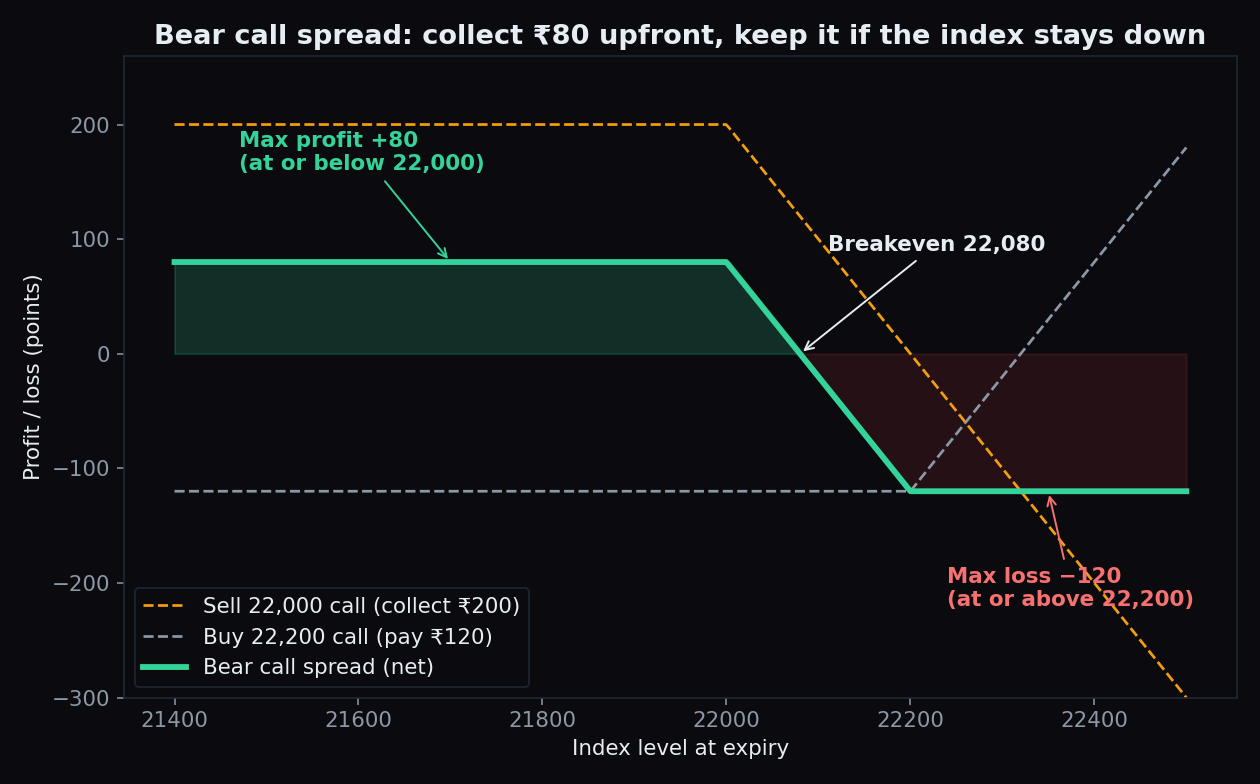
Because the short call sits at the money and the protection sits further away, the position wins whenever the market drifts sideways or down — and time decay works in its favour, since the position is a net seller of premium. The price of that comfort: the reward is the smaller of the two numbers, and the loss is the bigger one.
Same view, mirrored trade-offs
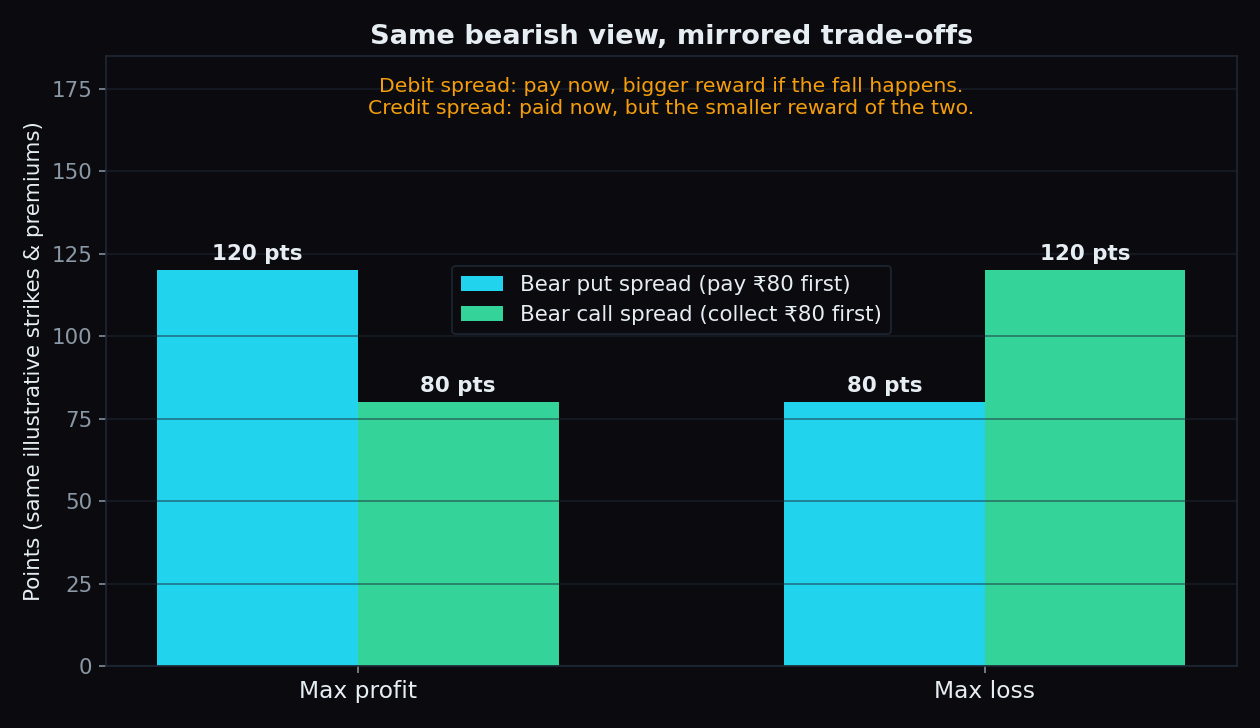
On these illustrative numbers, the bear put spread risks 80 to make up to 120; the bear call spread risks 120 to make up to 80. Neither ratio is "better" — each pays off in a different scenario:
- The debit (put) spread needs the fall to actually happen, and happen before expiry. If the market just drifts sideways, the 80 paid decays away.
- The credit (call) spread profits in more scenarios (down, flat, even slightly up) but earns less when right and loses more when wrong. Its comfort comes from win-frequency, not win-size — the same trade-off explained in risk–reward ratio.
One practical note for index options: the profit and loss above are in points per unit. A real position is sized in lots, so every figure gets multiplied by the lot size of the contract. And real premiums depend heavily on implied volatility — the same strikes can cost very different amounts on a calm day versus a nervous one.
The honest catch
- A spread reshapes the payoff; it does not create an edge. If the directional view is wrong, both versions lose — they just lose politely, with a known cap.
- Two legs mean two sets of costs. Brokerage, taxes and bid–ask slippage apply to each leg, and they bite hardest on narrow spreads where the theoretical edge is small.
- Capped profit is a real constraint. In a sharp crash, the bear put spread earns its 120 points and not a rupee more, while a plain put would keep gaining.
- Credit spreads feel pleasant until they don't. Collecting 80 to risk 120 means one full loss can erase more than one full win. The upfront credit is compensation for risk, not free money.
- Margin differs. A debit spread needs only the premium paid; a credit spread involves a short option, so the broker blocks margin against it.
Both spreads are ways of expressing a view about market direction — and direction is exactly where most guesswork lives. TrueTrend turns live Nifty, Bank Nifty and F&O positioning into one clear, at-a-glance read, and scores its own track record in public. Create a free account to see today's picture before forming a view.
See these concepts on live market data — free
Create a free TrueTrend account to watch daily support/resistance levels, market regime, and option-positioning charts on NIFTY, BankNifty and 12 more instruments. Every level we publish is scored on a public scoreboard — misses included. No card required.
Free forever tier · daily levels with published hit-rates across every instrument. Descriptive market structure, not investment advice.
Not ready for an account? Get the daily levels by email.
One short email each market day — the indices' call wall, put wall, gamma flip and max pain, and how the last session's levels scored. Free, no account, unsubscribe anytime.
Descriptive market structure, not investment advice. We never share your email.