The Butterfly Spread Explained: A Simple Illustrative Example
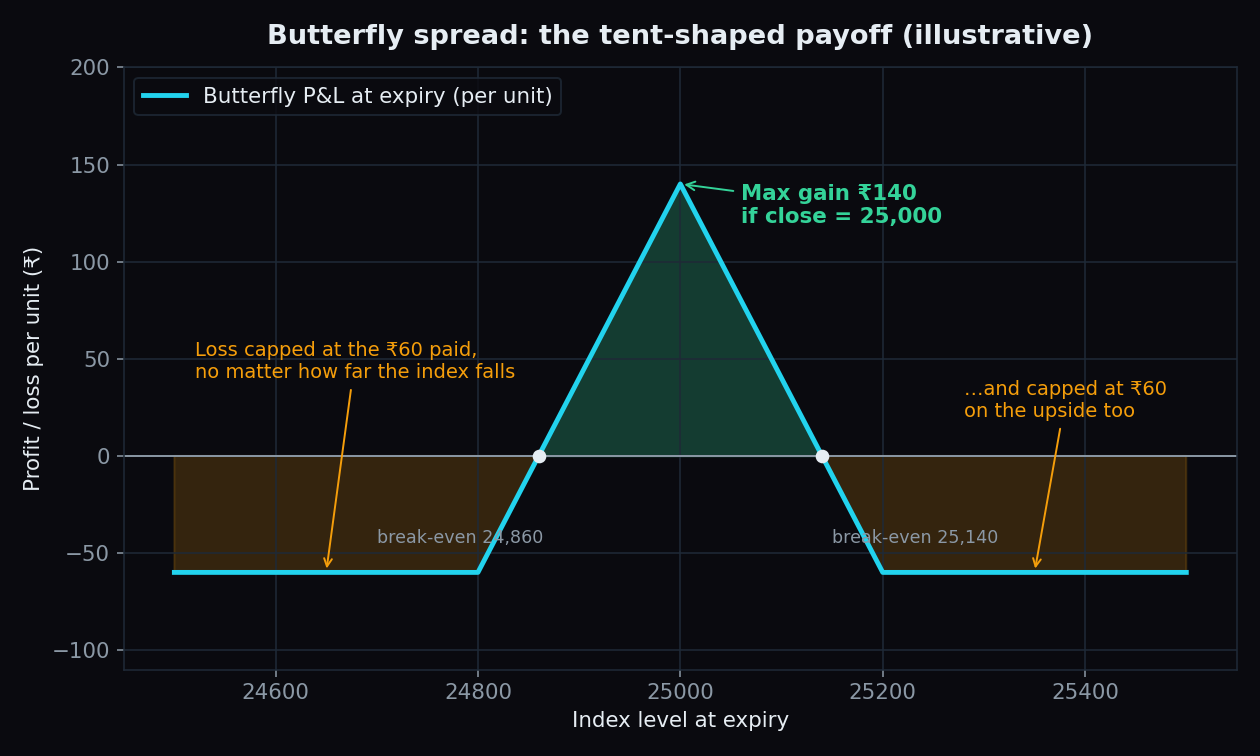
A butterfly spread is an option structure built from three strike prices. In the worked example below it costs ₹60 to set up, can gain at most ₹140, and cannot lose more than the ₹60 paid — no matter what the market does. It is a position that does best when the index goes nowhere. Here is the whole idea, explained simply with round numbers.
First, the building blocks
An option is a contract you pay for today — the price is called the premium — in exchange for a right that lives until a fixed date, the expiry. A call option gains value when the index rises above its strike price, the level written into the contract. If any of that is new, start with our plain-language guide to calls and puts, then come back — everything below is just those pieces stacked together.
One more idea helps: an option's premium melts as its expiry approaches, a process called time decay (covered in our theta explainer). The butterfly quietly puts that melting to work.
The idea: a small fee for a narrow landing zone
Think of a fairground coin-toss game. You pay a small fixed entry fee. If your coin lands dead centre on the board, you win the top prize. Land close to centre, you win something smaller. Miss the board entirely — on either side — and all you have lost is the entry fee. Nobody can lose more than the fee, and the prize is biggest at one exact spot.
That is a butterfly spread. The “entry fee” is a small net premium paid on day one. The “dead centre” is the middle strike. The structure pays best if the index finishes at that middle strike on expiry day, pays less as the close drifts away from it, and loses only the fee if the index finishes far away in either direction.
One butterfly, three strikes, four options
The classic version uses call options at three equally spaced strikes:
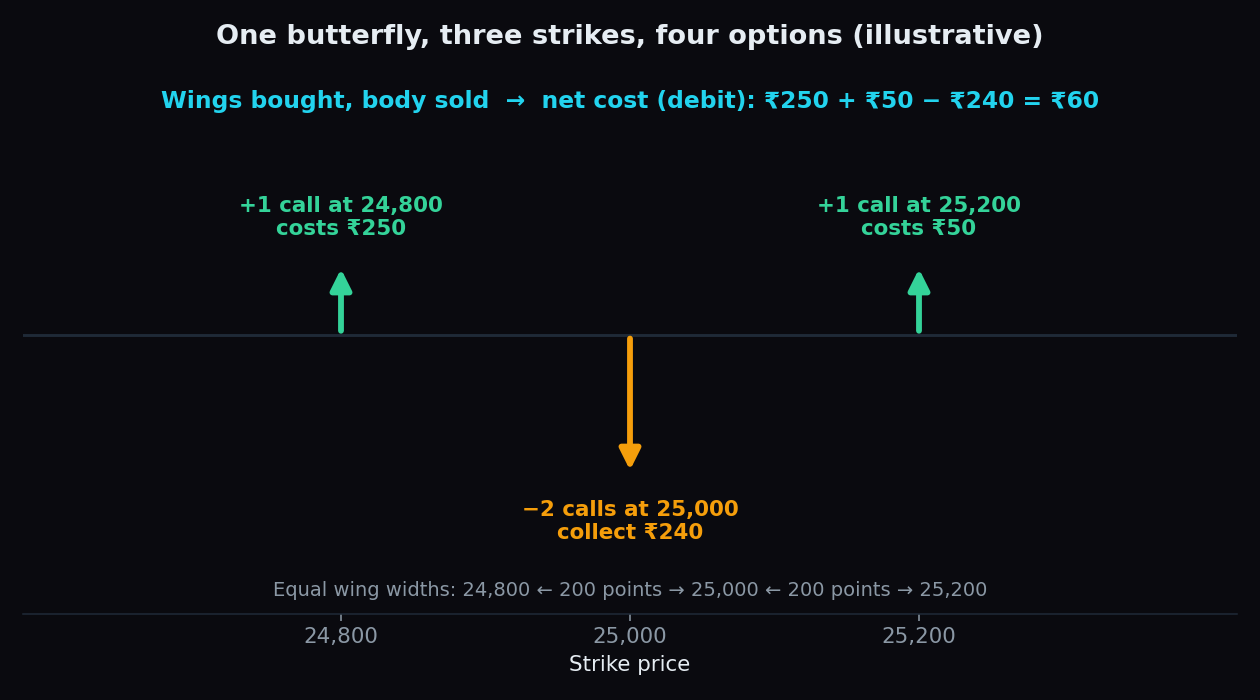
- The wings (bought): one call at the lower strike and one call at the upper strike.
- The body (sold): two calls at the middle strike.
Because the premium collected from the two middle calls does not quite cover the two wings, setting up the standard butterfly means a small payment out of pocket on day one. That outflow is the net debit, and in this structure it is also roughly the maximum possible loss (before transaction costs). The strikes must be equally spaced — the same number of points from the middle to each wing — for the maths below to hold.
A worked example with simple numbers
Say the index trades at 25,000. All premiums are invented to keep the arithmetic easy:
- Wing 1 (bought): one 24,800-strike call costs ₹250.
- Body (sold): two 25,000-strike calls are sold at ₹120 each, collecting ₹240.
- Wing 2 (bought): one 25,200-strike call costs ₹50.
- Net cost: ₹250 + ₹50 − ₹240 = ₹60. This is the debit, and roughly the most the position can lose.
Now roll forward to expiry and check three closes:
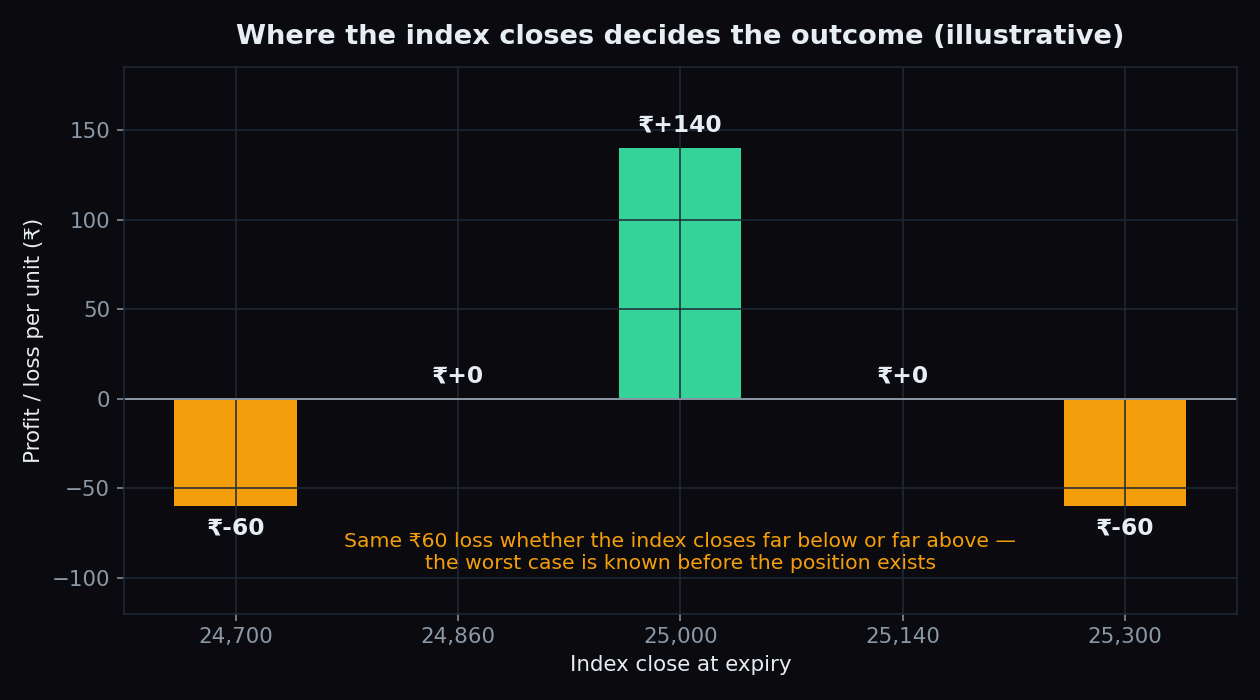
- Close at 25,000 (dead centre): the 24,800 call is worth 200 points; the two sold 25,000 calls and the 25,200 call finish worthless. The position is worth 200, and it cost 60 — a gain of ₹140 per unit. This is the maximum, and it needs the index to land exactly on the middle strike.
- Close far below 24,800: every call finishes worthless. Loss = the ₹60 paid, and nothing more.
- Close far above 25,200: all four calls are deep in the money and their values cancel out exactly (the two wings gain what the two sold calls lose). The position is worth zero — again a loss of just the ₹60 paid.
The two break-even points sit ₹60 — the debit — inside each wing: 24,800 + 60 = 24,860 on the way up, and 25,200 − 60 = 25,140 on the way down. Between those levels the position ends profitable; outside them it ends at a loss, capped at ₹60.
(Index options trade in lots, so real amounts multiply by the lot size, and brokerage and taxes eat into everything.)
The honest catch
A ₹140 possible gain on ₹60 at risk sounds generous. The market is not being generous — it is pricing a hard task:
- The landing zone is narrow. The full ₹140 needs the index to close exactly at 25,000. The profitable zone here is just 24,860–25,140 — a 280-point window — and an index moves more than that in plenty of weeks. The small debit reflects a genuinely low chance of a bullseye.
- The payoff only ripens at expiry. That crisp tent shape describes expiry day. Before then, the position's value drifts slowly; most of the potential gain appears only in the final days, as the sold middle calls decay. Patience is built into the structure.
- Four contracts, lots of friction. A butterfly crosses a bid–ask spread and pays charges on four option positions — on the way in and again on the way out. On a structure whose whole budget is ₹60, friction is a serious tax; see what one trade really costs.
- Nothing finishes politely on schedule. The example assumed a tidy close at 25,000. Real expiry sessions are messier — see how Indian expiry days actually behave.
Key takeaway: a butterfly spread is a defined-risk structure that trades a small, known premium for a payoff that peaks at one exact level. Its worst case is known on day one; its best case needs a near-bullseye close that nobody can promise in advance. The generous-looking ratio is the market's honest pricing of a low-probability event.
Cousins in the spread family
Seen one defined-risk structure, and the others become easy to read. An iron condor is a butterfly with the tent's peak flattened into a plateau — a wider landing zone in exchange for a smaller maximum gain. A bull call spread keeps two of the same legs but wants the index to move one way. And a long straddle is the butterfly's mirror image: it pays a large premium hoping the index travels far from the middle strike. Same building blocks, opposite opinions about quiet markets.
Structures like the butterfly live or die on where the index settles relative to the big option strikes. TrueTrend turns live Nifty and Bank Nifty option positioning into a clear, at-a-glance read — and scores its own track record in public instead of selling predictions. Create a free account to explore it.
See these concepts on live market data — free
Create a free TrueTrend account to watch daily support/resistance levels, market regime, and option-positioning charts on NIFTY, BankNifty and 12 more instruments. Every level we publish is scored on a public scoreboard — misses included. No card required.
Free forever tier · daily levels with published hit-rates across every instrument. Descriptive market structure, not investment advice.
Not ready for an account? Get the daily levels by email.
One short email each market day — the indices' call wall, put wall, gamma flip and max pain, and how the last session's levels scored. Free, no account, unsubscribe anytime.
Descriptive market structure, not investment advice. We never share your email.