Weekly vs Monthly Options: Expiry, Theta and Liquidity
Take two Nifty options at the same strike. One expires this coming Tuesday; the other expires at the end of the month. The monthly has four times as many trading days left — but it does not cost four times as much. It costs roughly twice as much. That single pricing quirk explains most of what separates weekly and monthly options: how fast they lose value, where the trading crowd sits, and how their final day feels. This guide walks through it with simple round numbers, and ends with what our own scored sessions actually show.
Same contract, different deadline
An option is a contract with a built-in deadline, called the expiry. A weekly option expires at the end of the current trading week. A monthly option expires once a month, on a fixed day near the month's end. After the closing bell on its expiry day, the contract simply stops existing.
Think of the two as identical cartons of milk with different use-by dates. The contents are the same — same index, same strike, same rules — only the date printed on top differs. But that date changes everything about how each carton is priced and how quickly its owner has to decide what to do with it.
New to how these contracts are listed and quoted? Our guide to reading an option chain covers strikes, premiums and open interest step by step.
Which Indian contracts still have a weekly?
Fewer than most people assume. India's expiry calendar was thinned out by the regulator between 2024 and 2025, and today it looks like this:
- Nifty has weekly options expiring every Tuesday on the NSE. Its monthly contract expires on the last Tuesday of the month.
- Sensex has weekly options expiring every Thursday on the BSE. Its monthly contract expires on the last Thursday.
- Bank Nifty, FinNifty, Midcap Nifty and Bankex are monthly-only. Their weekly contracts were discontinued from late November 2024, after SEBI limited each exchange to one weekly index expiry.
- Stock options (Reliance, HDFC Bank and the rest) have always been monthly-only in India. They also differ in settlement: index options are settled in cash, while stock options can end in the actual delivery of shares.
So "weekly or monthly" is not always a choice. For Nifty and Sensex you have two clocks on the wall; for everything else in the F&O list, the monthly clock is the only one. The two index expiry days themselves are compared in Nifty Tuesday vs Sensex Thursday. Expiry rules have changed several times, so treat the exchange circulars as the current word.
Theta: the same melt, at different speeds
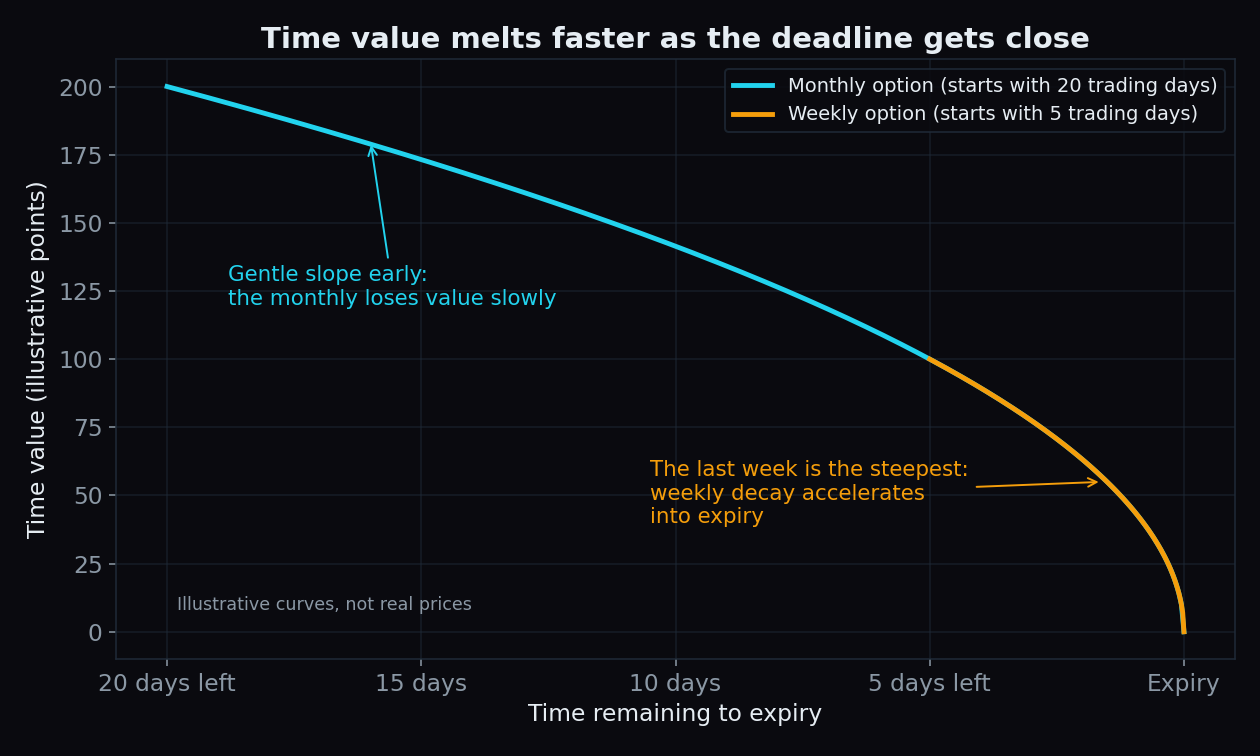
An option's price has two parts: the real, already-in-the-money part, and time value — the extra amount paid for what might still happen before the deadline. (We separate the two in intrinsic value vs time value.) Time value always shrinks as the deadline nears. The daily rate of that shrinkage is called theta, and it is not steady: decay is gentle at first and accelerates sharply in the last few days. The mechanics are in option theta explained.
Here is the key consequence. A weekly option spends its entire life on the steep part of that curve. A monthly option spends its first three weeks on the gentle slope and only its final week on the cliff. They are not different products; the weekly is simply the last leg of the monthly's journey, sold on its own.
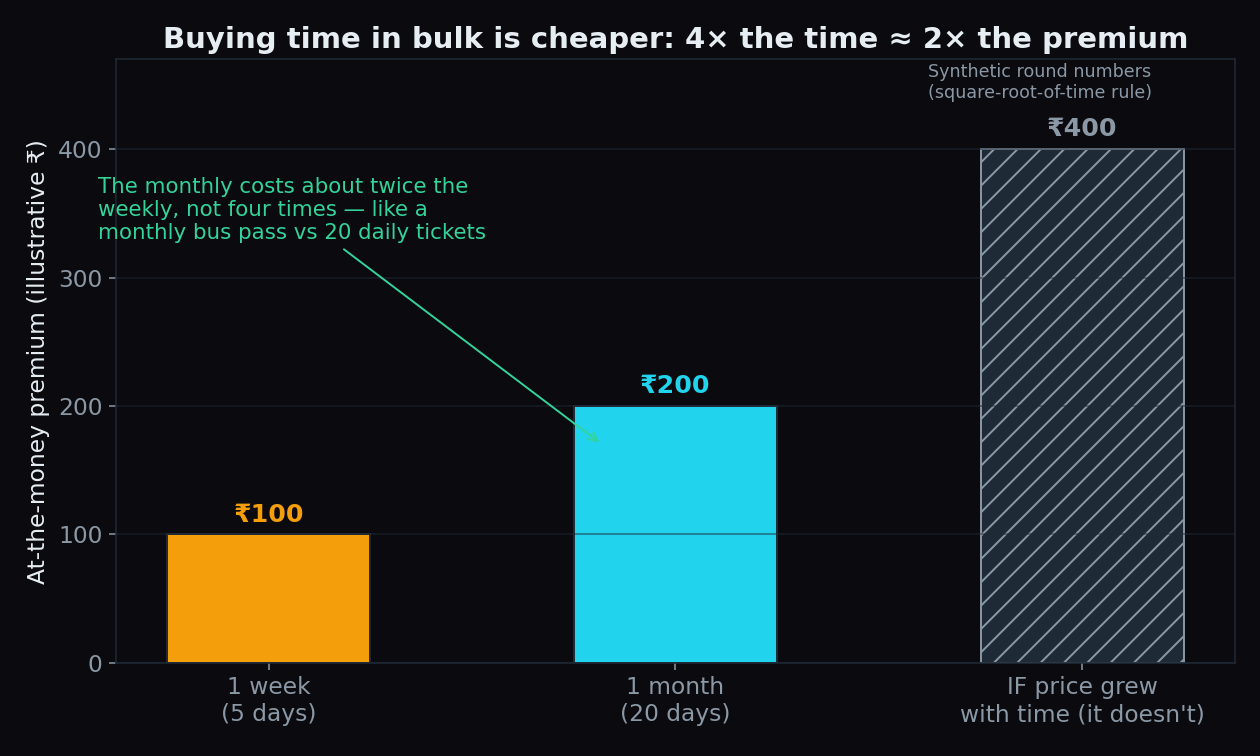
A worked example, with round numbers. Say Nifty is near 25,000 and the at-the-money 25,000 option with 5 trading days left is quoted around ₹100. The same strike with 20 trading days left is not ₹400. It is around ₹200. Option time value grows roughly with the square root of time remaining: four times the days, about twice the premium. Time bought in bulk is cheaper per day, much like a monthly bus pass against twenty single tickets.
Now flip it around and ask what each contract costs per day. The weekly's ₹100 has to reach zero in five days — an average of about ₹20 a day, and faster than that at the very end. The monthly's ₹200 drifts down by roughly ₹7 a day through its first three weeks, then hits the same ₹20-a-day melt in its final week.
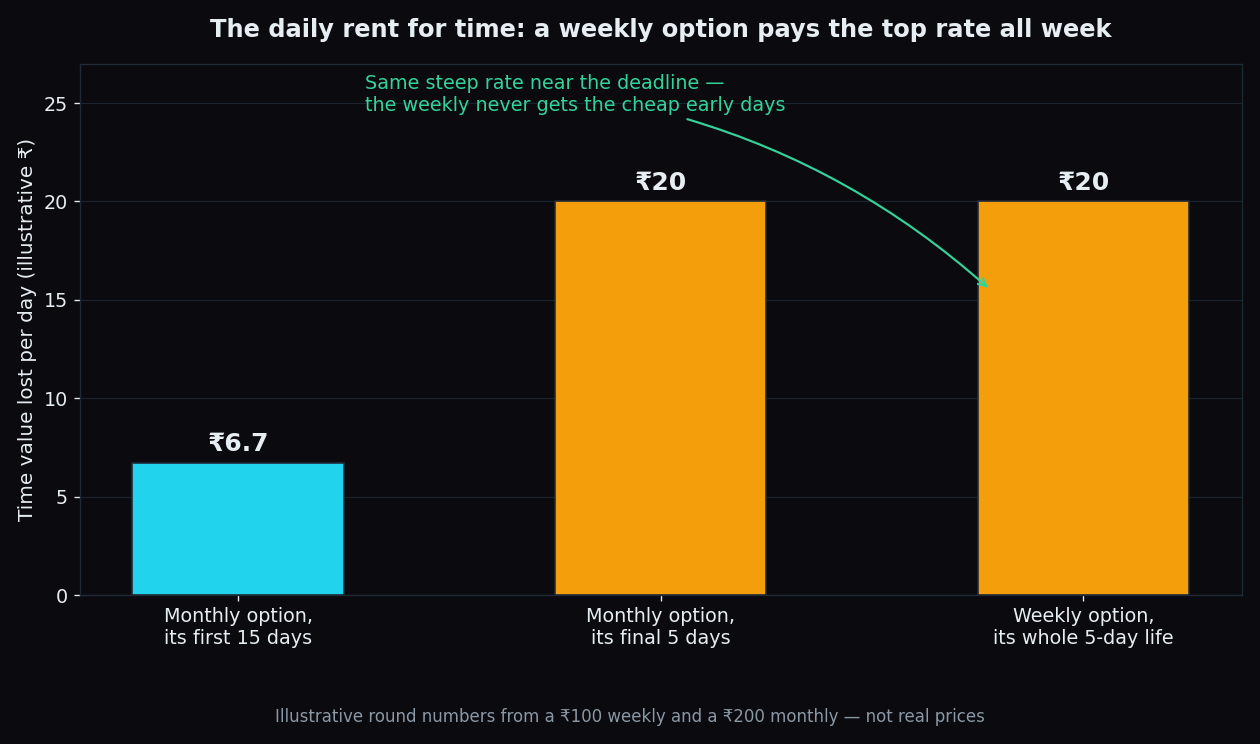
That is the honest trade in one line: the weekly is cheap in rupees and expensive in time. Whoever owns it pays the highest daily rent in the market; whoever writes it collects that rent, while sitting closest to the sharp price swings of the final sessions.
Liquidity: where the crowd sits
Liquidity is how easily you can get in and out of a contract without moving its price. The everyday measure is the bid–ask spread, the gap between the best price on each side. Busy contracts have a narrow gap; quiet ones have a wide gap that quietly taxes every entry and exit as slippage.
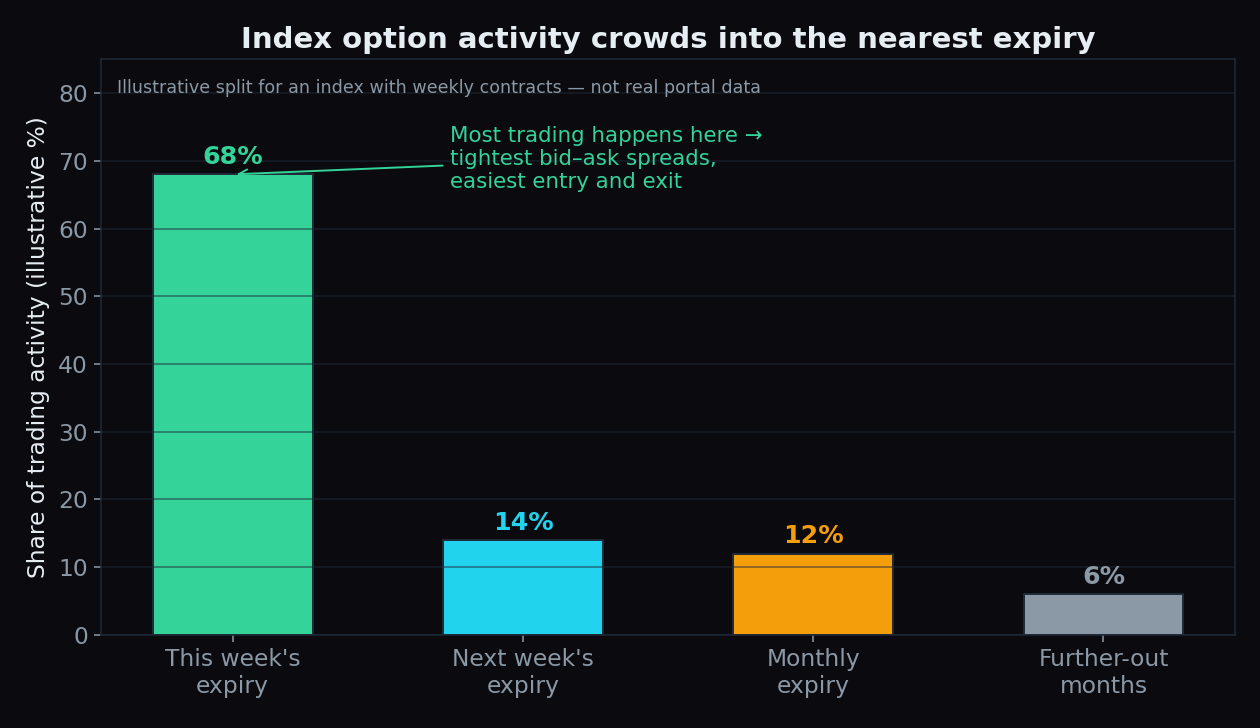
For Nifty and Sensex, activity crowds into the nearest weekly expiry. That is where quotes refresh constantly and spreads are tightest. The monthly contract stays reasonably active, because hedges and longer-dated positions live there. Further-out months are thin: wider spreads, patchier quotes, and a bigger gap between the screen price and the price you actually get.
For Bank Nifty, FinNifty and single stocks there is no weekly to crowd into, so the current monthly carries almost all the activity. Stock options are thinner than index options to begin with, and thin out sharply at strikes far from the current price.
The practical shape of it: near-dated and near-the-money is where the liquidity lives. Far-dated and far-from-the-money is where the spread quietly eats the edge.
What our scored sessions actually show
The tidy story is that weekly expiries concentrate hedging activity near heavy strikes, so indices with weeklies should "pin" — finish close to their max-pain strike — more often than monthly-only ones. We can check that against our own archive rather than repeat it.
TrueTrend snapshots the option chain at around 09:30 IST each session, computes the day's levels from it, and scores them against how the day actually closed, counting every miss. The method and live numbers sit on our public scoreboard (roughly 880 scored instrument-sessions across 14 instruments so far). Reading the max-pain figures as of 26 July 2026:
- Nifty (weekly, Tuesday) closed within one strike of its morning max-pain level in 37% of scored sessions (n=70).
- Sensex (weekly, Thursday) did so in 13% of sessions (n=70).
- Bank Nifty (monthly-only) did so in 12% of sessions (n=69).
- FinNifty (monthly-only) did so in 14% of sessions (n=70).
Look at that ordering carefully, because it does not say what the tidy story predicts. If weekly contracts were the thing driving pinning, both weekly names should stand apart. They do not: Sensex, which has weeklies, sits at 13%, right beside the two monthly-only indices at 12% and 14%. Nifty is the outlier, and something other than "it has a weekly" is doing the work.
Two caveats keep this honest. First, "within one strike" is a stricter test for Sensex: it trades at roughly three times Nifty's level while its strikes are only twice as far apart, so one Sensex strike is a narrower band in percentage terms. Second, these are all scored sessions, not expiry days only, and around seventy sessions per index is a small archive. This is a pattern so far, not a proven cause.
Key takeaway: having a weekly expiry did not, in our data, come with more pinning. Nifty pinned within one strike of max pain in 37% of sessions (n=70) while Sensex — also weekly — managed 13% (n=70), the same neighbourhood as monthly-only Bank Nifty at 12% (n=69). Expiry structure is context to read, not a rule to lean on.
The honest catch
- Cheap is not the same as good value. The weekly's low premium comes attached to the fastest decay in the market. If the index stands still for two days, a large slice of that premium is simply gone.
- The rent comes with risk attached. Writers of weeklies collect the richest daily decay, but near-expiry contracts also react hardest when the index moves. The same closeness to the deadline causes both.
- Monthly-only names have one big day. Without a weekly rhythm, expiry effects in Bank Nifty, FinNifty and stock options bunch into a single session a month — and stock options add the question of physical delivery.
- Our samples are small and live. Around seventy scored sessions per index so far. These percentages will move as the archive grows, which is exactly why we publish them live instead of freezing a flattering number.
- The calendar itself keeps changing. India's expiry rules were rewritten more than once between 2023 and 2025 and can change again. Check the current NSE and BSE circulars for contract details before relying on any of the days above.
Weekly and monthly structure is far easier to follow when you can see it in one place. TrueTrend turns each morning's option positioning — walls, max pain, market regime — into a clear, at-a-glance read across Nifty, Bank Nifty, Sensex and major F&O stocks, and it scores its own hit-rates in public, misses included. Create a free account and see today's picture before the next expiry.
See these concepts on live market data — free
Create a free TrueTrend account to watch daily support/resistance levels, market regime, and option-positioning charts on NIFTY, BankNifty and 12 more instruments. Every level we publish is scored on a public scoreboard — misses included. No card required.
Free forever tier · daily levels with published hit-rates across every instrument. Descriptive market structure, not investment advice.
Not ready for an account? Get the daily levels by email.
One short email each market day — the indices' call wall, put wall, gamma flip and max pain, and how the last session's levels scored. Free, no account, unsubscribe anytime.
Descriptive market structure, not investment advice. We never share your email.