Volatility Smile and Skew: Why OTM Puts Cost More
Put Nifty at 25,000 and look at two options the same distance away: the 24,500 put and the 25,500 call, each exactly 500 points from the index. If the market treated a rise and a fall as equally likely, the two should cost roughly the same. They almost never do. Day after day, on nearly every index option chain in the world, the put trades dearer. That tilt has a name — the volatility skew — and it is one of the most honest numbers in the market, because it prices fear directly. This guide explains what the smile and the skew are, why the put side stays expensive, and what the curve can — and cannot — tell you.
A sixty-second refresher
Three terms carry this whole article, so let's define them once.
- A call option pays off if the index finishes above a chosen level (its strike); a put option pays off if the index finishes below it. The basics are in calls and puts explained.
- Out of the money (OTM) means the strike is beyond the current price, so the option only pays if the index travels there. With Nifty at 25,000, the 25,500 call and the 24,500 put are both OTM. More in moneyness: ITM, ATM and OTM.
- Implied volatility (IV) is the amount of future movement an option's price implies, worked backwards from what the option actually costs. Higher IV means a dearer option. The full walkthrough is in implied volatility explained.
One consequence matters here: because IV is extracted from the option's price, comparing IV across strikes is a clean way to compare how richly each strike is priced, with the effects of distance and time already stripped out.
The smile and the skew, in one picture
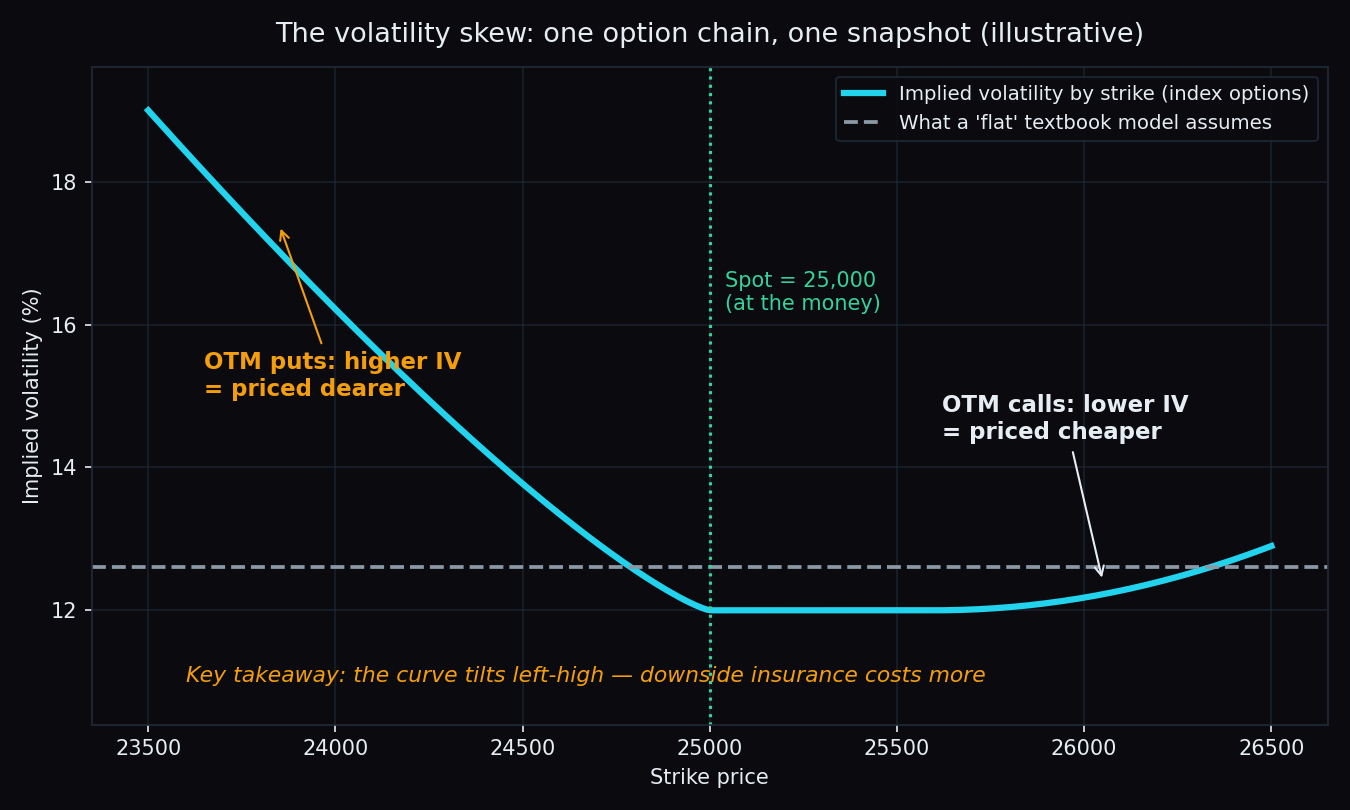
The classic textbook model of option pricing (Black–Scholes) assumes a single volatility for the whole market. If that were true, plotting each strike's IV against its strike price would draw a flat, boring line: every strike priced with the same expectation of movement.
Real option chains refuse to draw that line. Plot the IV of every strike, from deep below the current price to far above it, and you usually get a curve:
- A volatility smile is when both far ends sit higher than the middle, like the corners of a grin. It is common in currency options, where a sharp move in either direction is considered plausible.
- A volatility skew (sometimes called a "smirk") is when the curve tilts: the left, put side sits markedly higher than the right, call side. This is the standard shape for equity indices — Nifty, Sensex, the S&P 500 and most others.
The tilt is not a rounding error, and it was not always there. Before October 1987, US index options traded at nearly the same IV across strikes. Then came Black Monday, when the S&P 500 fell more than 20% in a single session — and crash protection never traded cheap again. The skew has been a permanent feature of equity index option markets since.
Why the put side costs more
Think of options as insurance policies with a market price. The put side of an index option chain is flood insurance for people who live beside a river — and nearly everyone in the stock market lives beside the river: they own shares, so the flood they fear is a fall. Three forces keep that insurance dear.
1. Insurance demand is one-way
Mutual funds, pension funds, insurers and large investors hold enormous stock portfolios. To protect those holdings they routinely pay for OTM puts — the protective put is one of the oldest hedging tools there is. Very few participants need protection against a rally, so there is steady, structural demand lifting put prices (and therefore put IV), with no mirror-image demand on the call side. On top of that, a popular income strategy — writing covered calls against existing holdings — adds a steady supply of calls, nudging call IV the other way.
2. Markets take the stairs up and the elevator down
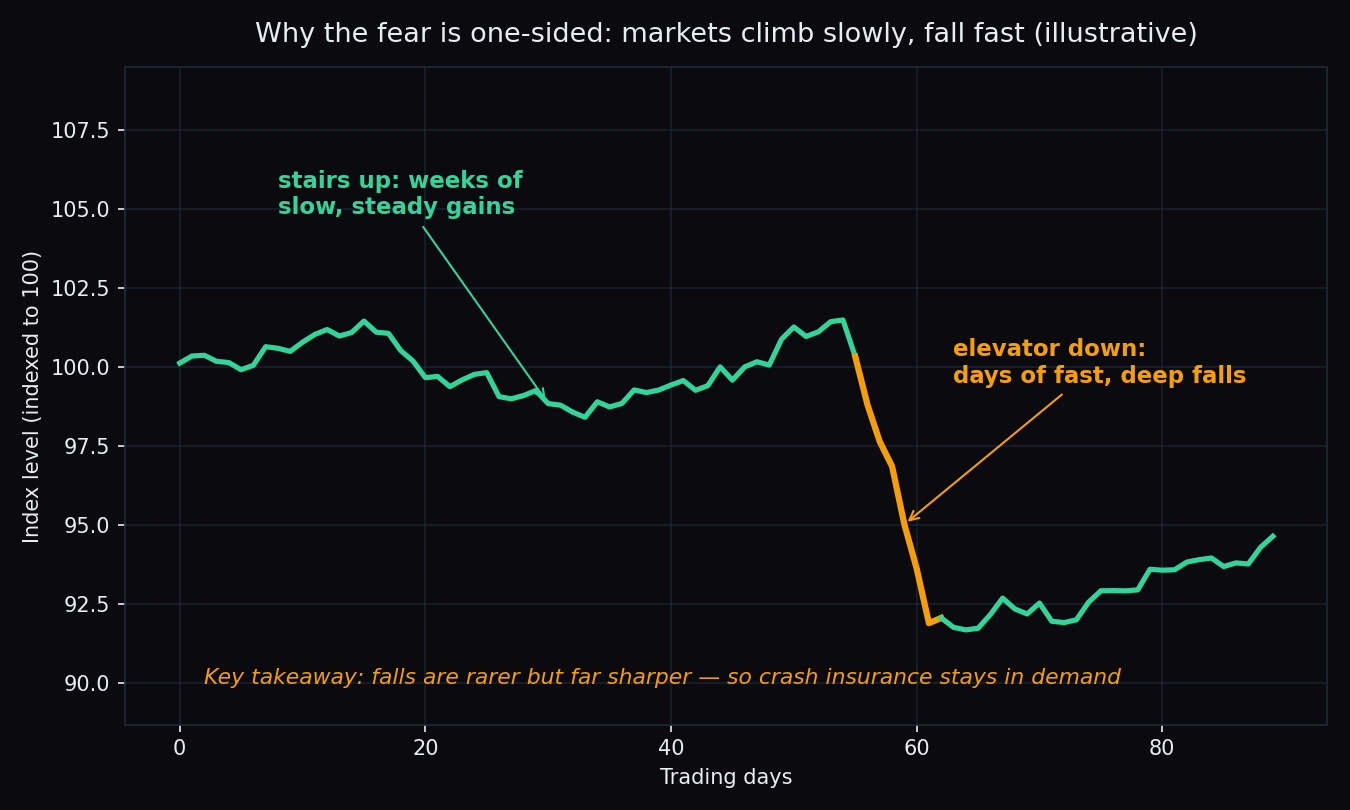
Rises tend to be slow grinds spread over weeks; falls tend to be fast and violent, packed into days. A model that assumes symmetric moves will underprice large falls. Statisticians call this a fat left tail: extreme down-days occur far more often than a tidy bell curve predicts. Option markets learned this the hard way and now price it in — which shows up as extra IV on downside strikes.
3. Danger pay for the writer
Whoever writes an OTM put is playing insurance company against a crash: collecting a small premium most months, and facing an enormous claim once in a while. A rational writer demands extra compensation for that lopsided risk — just as earthquake cover costs more in an earthquake zone. That compensation is baked into the put's price.
A worked example with simple numbers
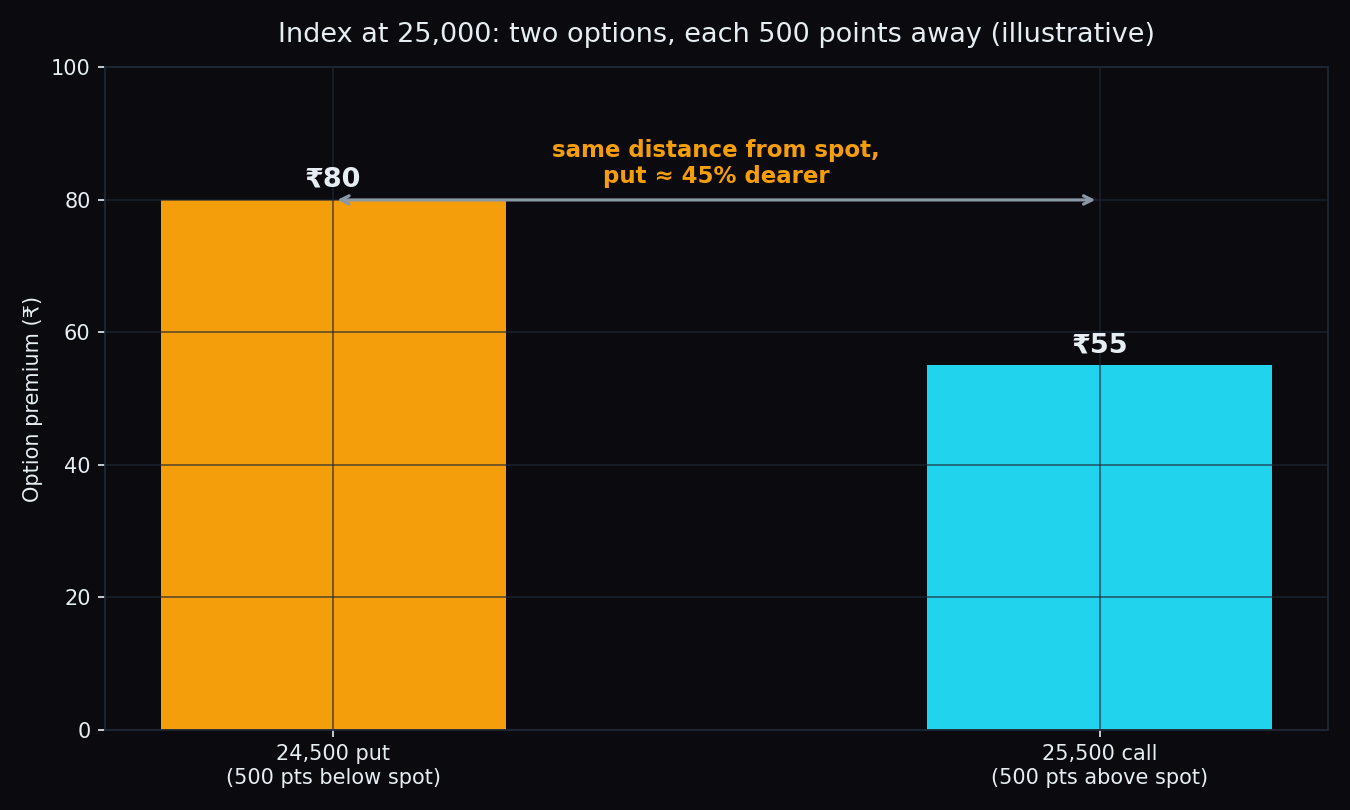
Here are illustrative round numbers for a chain with about a month to expiry, index at 25,000:
- The 25,500 call — 500 points OTM — quotes near ₹55, an IV of roughly 12%.
- The 24,500 put — also 500 points OTM — quotes near ₹80, an IV of roughly 15%.
Same index, same expiry, same distance from the spot price — yet the put costs about 45% more. The extra ₹25 is not a pricing mistake waiting to be corrected. It is the market's standing bill for downside fear, and it is there almost every day.
You can check the real thing in two minutes: open the Nifty option chain on the NSE website and compare the IV columns at strikes equally far below and above the spot. On a normal day, the put side reads a few percentage points higher.
How traders read the skew
Because the skew prices fear, its shape moves with the market's mood:
- A steepening skew — put IV rising faster than call IV — usually means demand for downside protection is heating up, even if the index itself looks calm.
- A flattening skew suggests the opposite: hedging demand easing, sometimes because nerves have settled, sometimes because a fall has already happened and hedges are being unwound.
India's official fear gauge is built on exactly this: India VIX is computed from the order-book prices of OTM Nifty options across a range of strikes, so the put skew literally feeds the number on the screen. And because option prices respond to IV directly, a shift in the skew moves premiums even when the index goes nowhere — that sensitivity is vega.
The honest catch
First: the skew is normal, not news. It is present on quiet days and wild ones alike, so a steep put skew is not, by itself, a crash forecast — most days it is simply the insurance market doing its usual business. What is worth watching is change: a skew steepening quickly against a calm index is a mood shift; a steady skew is just weather.
Second: expensive does not mean rewarding, on either side. Most OTM puts expire worthless, exactly like most insurance policies end without a claim — whoever owns them pays a persistent premium for protection that is rarely used. Whoever writes them collects small amounts in front of a rare, very large loss. The skew is compensation for real risk, not a loophole; neither side of it is free money.
Third: IV itself is perishable. When a feared event passes without disaster, the fear premium deflates quickly and option prices fall even if the index barely moves — the mechanics of that are in IV crush explained.
Key takeaway: the volatility skew is the market's insurance bill, printed strike by strike. OTM puts carry higher IV than OTM calls because downside protection is what almost everyone queues up to own — structural demand, fat left tails and danger pay for writers keep it that way. TrueTrend turns this kind of positioning — option walls, hedge pressure and expected moves across Nifty, Bank Nifty and the wider F&O list — into a clear, at-a-glance daily read, and scores its own levels in public. Create a free account to see today's picture.
See these concepts on live market data — free
Create a free TrueTrend account to watch daily support/resistance levels, market regime, and option-positioning charts on NIFTY, BankNifty and 12 more instruments. Every level we publish is scored on a public scoreboard — misses included. No card required.
Free forever tier · daily levels with published hit-rates across every instrument. Descriptive market structure, not investment advice.
Not ready for an account? Get the daily levels by email.
One short email each market day — the indices' call wall, put wall, gamma flip and max pain, and how the last session's levels scored. Free, no account, unsubscribe anytime.
Descriptive market structure, not investment advice. We never share your email.